Histogram Worksheet Page 2
ADVERTISEMENT
 1
1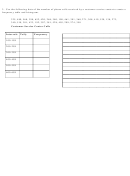 2
23. Use the following data of the number of phone calls received by a customer service center to create a
frequency table and histogram.
325, 489, 560, 398, 652, 420, 268, 380, 190, 461, 391, 368, 271, 308, 419, 539, 138, 273,
340, 519, 301, 423, 192, 307, 381, 528, 403, 299, 274, 350
Customer Service Center Calls
Intervals Tally
Frequency
100-199
200-299
300-399
400-499
500-599
600-699
ADVERTISEMENT
0 votes
Related Articles
Related forms


Related Categories
Parent category: Education