Histogram Worksheet
ADVERTISEMENT
 1
1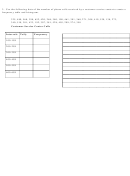 2
2Name____________________________________________Hour____________Date_______________
Histogram Worksheet
1. Complete the frequency table using the standardized test scores. Then make a histogram of the data.
Data: 83, 61, 63, 69, 99, 100, 80, 65, 83, 72, 71, 89, 94, 95, 76, 73, 79, 82, 91, 100, 68, 92, 91
Be careful to put the scores in the right box.
Science Test Scores
Interval
Tally
Frequency
61-70
71-80
81-90
91-100
2. Use the following data of the ages of teachers at a school to create a frequency table and histogram.
57, 44, 38, 24, 48, 39, 33, 38, 25, 40, 58, 37, 46, 42, 53, 33
Intervals
Tally
Frequency
20-29
30-39
40-49
50-59
ADVERTISEMENT
0 votes
Related Articles
Related forms


Related Categories
Parent category: Education