Holiday Home Work 2016-17 Class Viii Page 4
ADVERTISEMENT
 1
1 2
2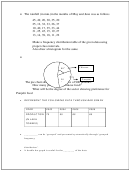 3
3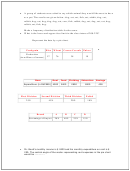 4
4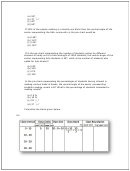 5
5 6
6 7
7 8
8 9
9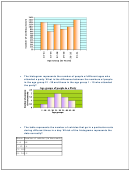 10
10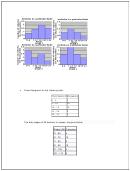 11
11 12
12 13
13 14
14 15
15 16
16 17
17 A group of students were asked to say which animal they would like most to have
as a pet. The results are given below: dog, cat, cat, fish, cat, rabbit, dog, cat,
rabbit, dog, cat, dog, dog, dog, cat, cow, fish, rabbit, dog, cat, dog, cat, cat, dog,
rabbit, cat, fish, dog.
Make a frequency distribution table for the same.
What is the lower and upper class limit in the class-interval 200-225?
Represent the data by a pie chart.
Foodgrain
Rice Wheat Coarse Cereals Pulses
Production
57
76
38
19
(in millions of tonnes)
Item
Rent
Food
Clothing
Education
Savings
Expenditure (in RUPEES) 4000
5400
2800
1800
400
First Division
Second Division
Third Division
Failed
25%
45%
20%
10%
Brand
A
B
C
D
Percentage of buyers
20%
40%
25%
15%
Mr. Bond's monthly income is $ 2400 and his monthly expenditure on rent is $
250. The central angle of the sector representing rent expenses in the pie chart
would be …………… .
ADVERTISEMENT
0 votes
Related Articles
Related forms


Related Categories
Parent category: Education