Holiday Home Work 2016-17 Class Viii Page 3
ADVERTISEMENT
 1
1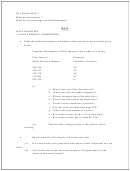 2
2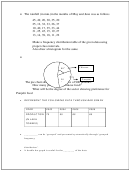 3
3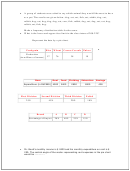 4
4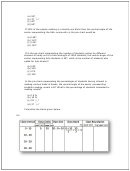 5
5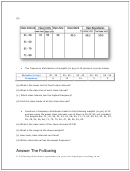 6
6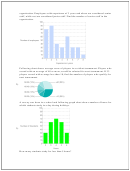 7
7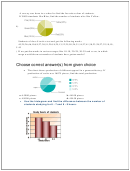 8
8 9
9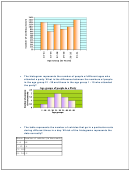 10
10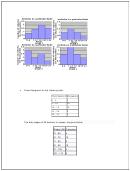 11
11 12
12 13
13 14
14 15
15 16
16 17
17 The rainfall (in mm.)in the months of May and June was as follows
45, 49, 20, 30, 35, 20
25, 12, 32, 33, 26, 37
10, 40, 17, 35, 33, 44
31, 25, 45, 15, 19, 27
13, 14, 39, 18, 11, 22
Make a frequency distribution table of the given data using
proper class intervals.
Also draw a histogram for the same.
Chinese
80
0
50
Punjabi
The pie chart shows food preference of 900 persons.
0
How many persons like Chinese food?
What will be the degree of the sector showing preference for
Punjabi food
REPRESENT THR FOLLOWING DATA THROUGH BAR GRAPH
YEAR
2003
2004
2005
2006
PRODUCTION
70
55
80
85
(IN LAKH
TONNES)
__________ can be ‘grouped’ and presented systematically through ‘grouped
frequency
distribution’.
A double bar graph is useful for the ________ of the data.
ADVERTISEMENT
0 votes
Related Articles
Related forms


Related Categories
Parent category: Education