Holiday Home Work 2016-17 Class Viii Page 10
ADVERTISEMENT
 1
1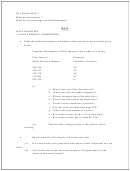 2
2 3
3 4
4 5
5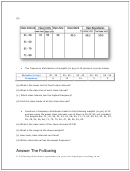 6
6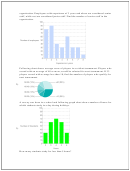 7
7 8
8 9
9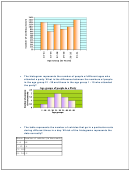 10
10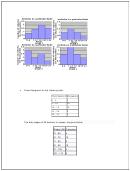 11
11 12
12 13
13 14
14 15
15 16
16 17
17
The histogram represents the number of people of different ages who
attended a party. What is the difference between the numbers of people
in the age group 21 - 30 and those in the age group 1 - 10 who attended
the party?
The table represents the number of vehicles that go in a particular route
during different times in a day. Which of the histograms represents the
data correctly?
Hours Number of vehicles (in thousands)
0 - 6
0.8
7 - 12 1.4
13 - 18 2
19 - 24 1.5
ADVERTISEMENT
0 votes
Related Articles
Related forms


Related Categories
Parent category: Education