Science Entry Examination Worksheet With Answers - Whitgift School Page 24
ADVERTISEMENT
 1
1 2
2 3
3 4
4 5
5 6
6 7
7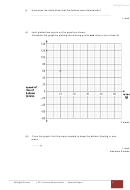 8
8 9
9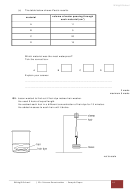 10
10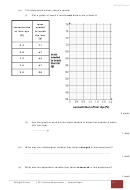 11
11 12
12 13
13 14
14 15
15 16
16 17
17 18
18 19
19 20
20 21
21 22
22 23
23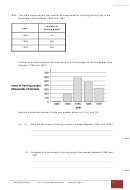 24
24 25
25 26
26 27
27 28
28 29
29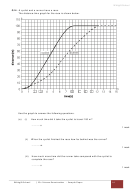 30
30 31
31 32
32 33
33 34
34 35
35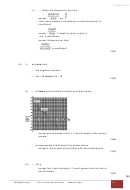 36
36 37
37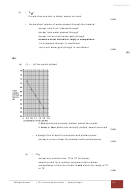 38
38 39
39 40
40 41
41 42
42 43
43 44
44 45
45 46
46 47
47 48
48 49
49 50
50Whitgift School
Q11. The table below shows the number of boats used for catching herring fish in the
Norwegian Sea between 1963 and 1967.
number of
year
fishing boats
1963
16
1965
284
1967
326
The bar chart below shows the total mass of herring caught in the Norwegian Sea
between 1963 and 1967.
Use the information above to help you answer parts (a) (i), (ii) and (iii).
(a)
(i)
Why did the mass of herring caught increase between 1963 and 1965?
...............................................................................................................
...............................................................................................................
1 mark
(ii)
Suggest why the mass of herring caught decreased between 1965 and
1967.
...............................................................................................................
...............................................................................................................
1 mark
Whitgift School
| 13+ Science Examination - Sample Paper
24
ADVERTISEMENT
0 votes
Related Articles
Related forms


Related Categories
Parent category: Education