Percents And Probability Worksheet With Answers - Lesson 12-19 Page 46
ADVERTISEMENT
 1
1 2
2 3
3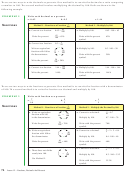 4
4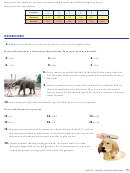 5
5 6
6 7
7 8
8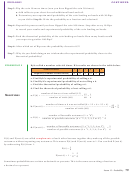 9
9 10
10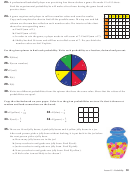 11
11 12
12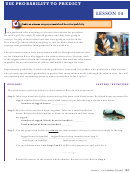 13
13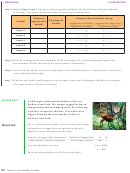 14
14 15
15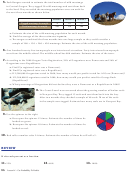 16
16 17
17 18
18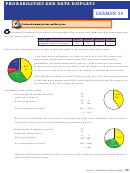 19
19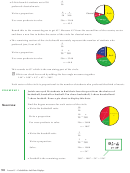 20
20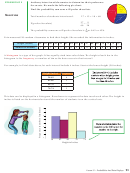 21
21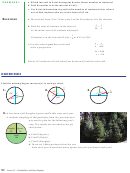 22
22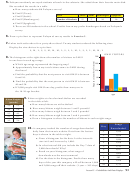 23
23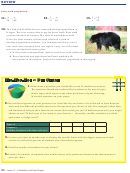 24
24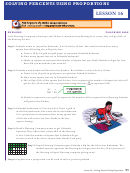 25
25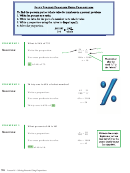 26
26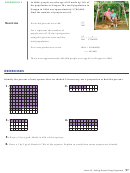 27
27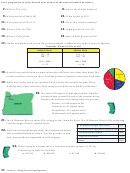 28
28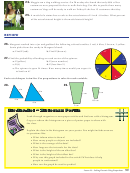 29
29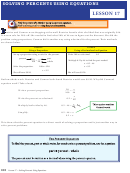 30
30 31
31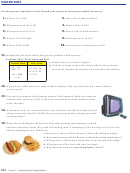 32
32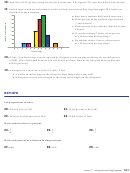 33
33 34
34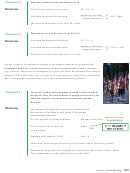 35
35 36
36 37
37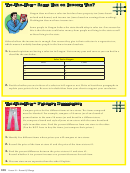 38
38 39
39 40
40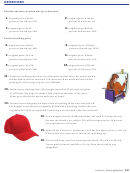 41
41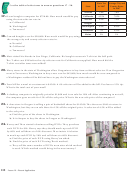 42
42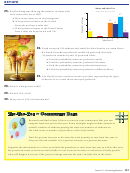 43
43 44
44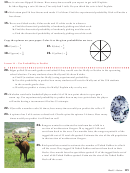 45
45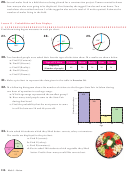 46
46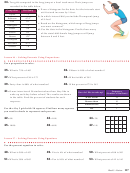 47
47 48
48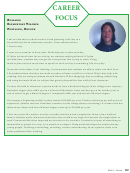 49
4926.
Several moles lived in a field that was being plowed for a construction project. Tamara wanted to know
how many moles were going to be displaced. One Saturday she tagged 5 moles and went home. Two
weeks later she watched and saw 3 of the tagged moles out of a total of 12 moles spotted. Estimate the
number of moles living in the field.
Lesson 15 ~ Probabilities and Data Displays
Find the missing degree measures in each pie chart.
1 _
27.
28.
29.
4
60°
1 _
120°
3
y°
x°
90°
x°
y°
z°
x°
180°
y°
1 __
25%
10
30.
Two hundred people were asked their favorite type of television show. The results are shown below.
a. Find P(Cartoon).
type of tV show
Cartoon
sitcom
reality
news
drama
b. Find P(Sitcom).
Frequency
c. Find P(Reality).
60
50
36
18
36
(number of people)
d. Find P(News).
e. Find P(Drama).
31.
Make a pie chart to represent the data given in the table in exercise 30.
32.
The following histogram shows the number of visitors to the Oregon State Fair in Salem during
one hour of operation in each age range.
400
a. Which age range represented the smallest group?
400
b. How many total people came to the State Fair
300
during that hour?
300
c. Find the probability that the next person to come
200
in will be between 20 and 40 years old.
200
100
100
0
20
40
60
80
Age
33.
Kevin asked 40 students which they liked better: carrots, celery or tomatoes.
The results are displayed in the pie chart.
a. Find P(carrots).
b. Find P(celery).
celery
c. Find P(tomatoes).
10
tomatoes
d. Kevin asked 200 students which vegetable they liked
15
carrots
better. Predict how many would like carrots best.
15
116
Block 3 ~ Review
ADVERTISEMENT
0 votes
Related Articles
Related forms


Related Categories
Parent category: Education