Percents And Probability Worksheet With Answers - Lesson 12-19 Page 34
ADVERTISEMENT
 1
1 2
2 3
3 4
4 5
5 6
6 7
7 8
8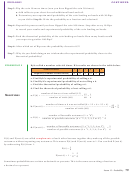 9
9 10
10 11
11 12
12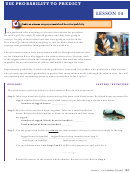 13
13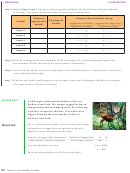 14
14 15
15 16
16 17
17 18
18 19
19 20
20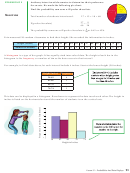 21
21 22
22 23
23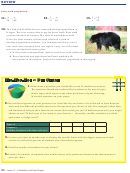 24
24 25
25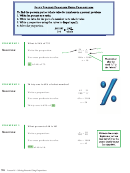 26
26 27
27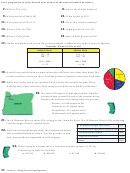 28
28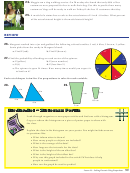 29
29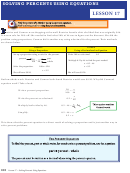 30
30 31
31 32
32 33
33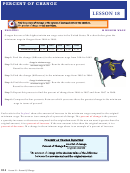 34
34 35
35 36
36 37
37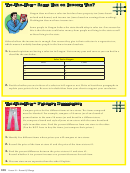 38
38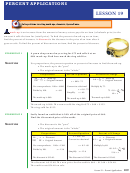 39
39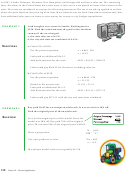 40
40 41
41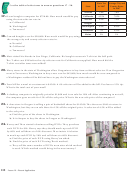 42
42 43
43 44
44 45
45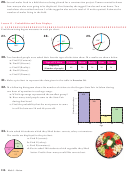 46
46 47
47 48
48 49
49Percent OF change
Lesson 18
exPlOre!
minimum wage
Oregon has one of the highest minimum wage rates in the United States. Th e chart below gives the
minimum wage in Oregon from 2004 to 2008.
Year
2004
2005
2006
2007
2008
Minimum Wage
$7.05
$7.25
$7.50
$7.80
$7.95
step 1: Find the change (diff erence) in the minimum wage from 2004 to 2005.
change in minimum wage
step 2: Find the ratio
__________________
. Rewrite the ratio as a percent.
minimum wage in 2004
Round to the nearest tenth.
step 3: Find the change (diff erence) in the minimum wage from 2005 to 2006.
change in minimum wage
_______________
step 4: Find the ratio
. Rewrite the ratio as a percent.
minimum wage in 2005
Round to the nearest tenth.
step 5: Repeat this process to fi nd the percent of change from 2006 to 2007 and from 2007 to 2008.
step 6: Compare the four percents. Between which years was there the greatest change in the minimum
wage in terms of percent?
Each ratio in the
Explore!
shows the amount of increase in the minimum wage compared to the original
percent of change
minimum wage. Th e answer is an example of a percent of change. Th e
is the percent
a quantity increases or decreases compared to the original amount. If the new amount is greater than the
original amount, it is a
percent of
increase. If the new amount is less than the original amount, it is a
percent of
decrease. Th e change in the minimum wage above is an example of a percent of increase.
104
Lesson 18 ~ Percent Of Change
ADVERTISEMENT
0 votes
Related Articles
Related forms


Related Categories
Parent category: Education