Percents And Probability Worksheet With Answers - Lesson 12-19 Page 23
ADVERTISEMENT
 1
1 2
2 3
3 4
4 5
5 6
6 7
7 8
8 9
9 10
10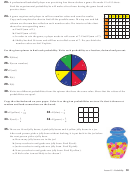 11
11 12
12 13
13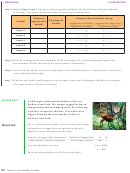 14
14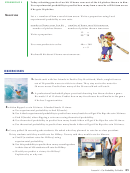 15
15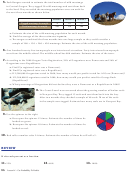 16
16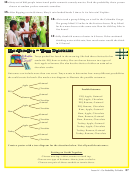 17
17 18
18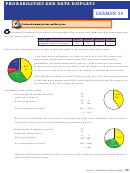 19
19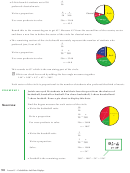 20
20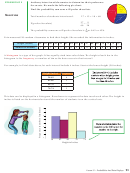 21
21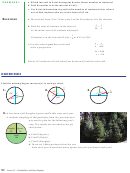 22
22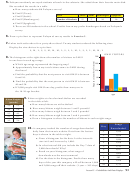 23
23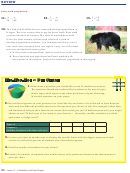 24
24 25
25 26
26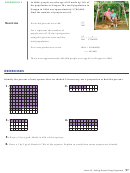 27
27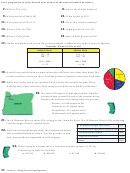 28
28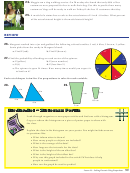 29
29 30
30 31
31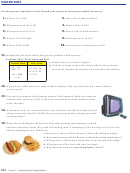 32
32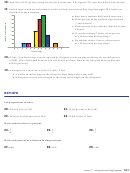 33
33 34
34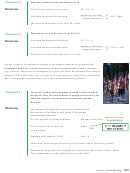 35
35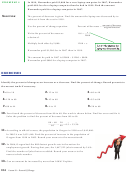 36
36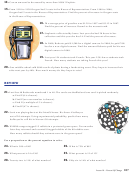 37
37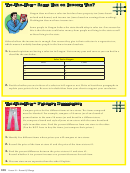 38
38 39
39 40
40 41
41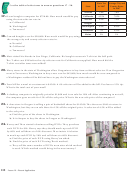 42
42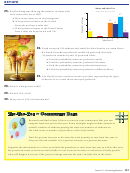 43
43 44
44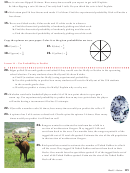 45
45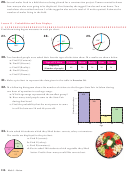 46
46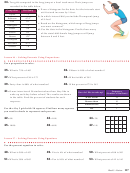 47
47 48
48 49
495.
Zuleyma randomly surveyed students at lunch in the cafeteria. She asked them their favorite main dish.
She recorded the results in a table.
a. How many students did Zuleyma survey?
b. Find P(Tacos).
Food
tacos
sushi
hamburgers
spaghetti
c. Find P(Sushi).
number of students
15
5
20
10
d. Find P(Hamburgers).
e. Find P(Spaghetti).
f. There are 950 students in the school. Predict how many prefer hamburgers based on Zuleyma’s
survey.
6.
Draw a pie chart to represent Zuleyma’s survey results in exercise 5.
7.
Lukas took soda orders for a party after school. Twenty students ordered the following sizes.
Display the size choices in a pie chart.
S, M, L, S, S, M, M, M, L, S, L, L, M, L, S, L, L, M, M, L
OMSI VISITORS
8.
200
The histogram at the right shows the number of visitors to OMSI
in one hour in each age range.
a. Which age range represented the largest group?
180
b. Approximately how many total visitors came to OMSI during
that hour?
120
c. Find the probability that the next person to visit OMSI is between
0 and 10.
80
d. Find the probability that the next person to visit OMSI is between
40 and 50.
40
e. If 2,000 people visit OMSI one day, predict how many are in
200 30 70 100
20
20
the 10-20 age bracket.
0
10
20
30
40
50 60
ages
9.
Kitten weights at a local animal shelter are recorded
Kitten Weights
in the table at left.
(pounds)
a. How many kittens are at the shelter?
2.9
1.2
b. How many kittens weigh between 1 and 2 pounds?
3.4
1.8
c. How many kittens weigh between 2 and 3 pounds?
2.3
4.1
d. How many kittens weigh between 3 and 4 pounds?
2.5
1.7
e. Draw a histogram to show the number of kittens in each weight range.
3.2
2.6
songs
day
10.
A company tracked the number of songs downloaded
downloaded
daily from their music website. Data from the last ten
1
1,294
days is shown in the table at right.
2
3,810
a. Draw a histogram for the data. Let the intervals
3
1,984
start at 0 and increase by 1,000.
4
2,458
b. In what interval did you include the Day 7 data of
5
1,723
3,000 downloads? Why?
6
2,917
c. Based on your histogram, what range of
7
3,000
downloads was the most common?
8
982
d. Use the data in the histogram. Predict how many
9
1,450
days of the year this company will sell between 1,000
10
2,725
and 2,000 songs off their website. (1 year = 365 days)
93
Lesson 15 ~ Probabilities And Data Displays
ADVERTISEMENT
0 votes
Related Articles
Related forms


Related Categories
Parent category: Education