Percents And Probability Worksheet With Answers - Lesson 12-19 Page 22
ADVERTISEMENT
 1
1 2
2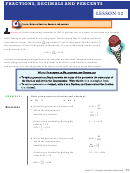 3
3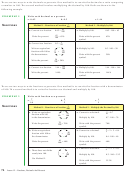 4
4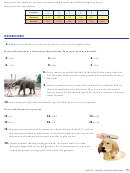 5
5 6
6 7
7 8
8 9
9 10
10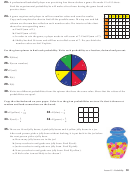 11
11 12
12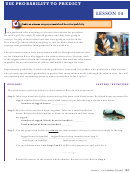 13
13 14
14 15
15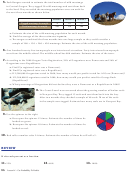 16
16 17
17 18
18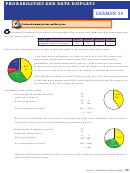 19
19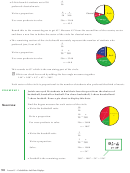 20
20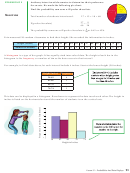 21
21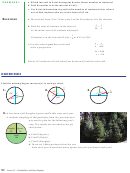 22
22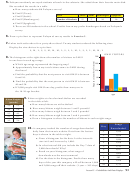 23
23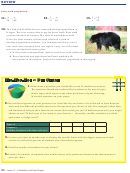 24
24 25
25 26
26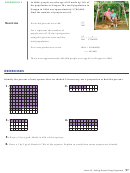 27
27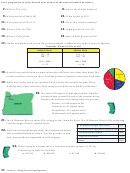 28
28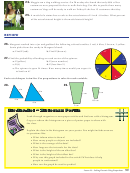 29
29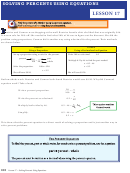 30
30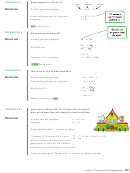 31
31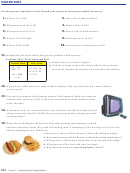 32
32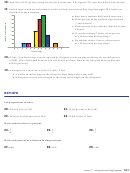 33
33 34
34 35
35 36
36 37
37 38
38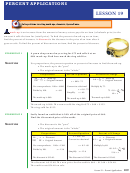 39
39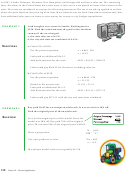 40
40 41
41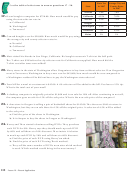 42
42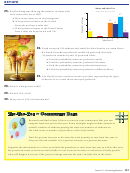 43
43 44
44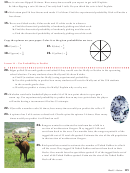 45
45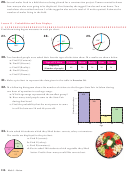 46
46 47
47 48
48 49
49a. Which interval in erin’s histogram has the fewest number of students?
examPle 3
b. Find P(student is in the interval 62-66).
c. use erin’s information to predict the number of students in her school
out of 860 students who are in the interval 62-66.
s
a. The interval from 70 to 74 has only 2 of the 20 students. It is the shortest.
olutions
5 __
= 1 _
b. Find the ratio of students in the interval
20
4
62-66 inches out of 20 students measured.
1 _
P(student is in the interval 62-66) =
or 0.25 or 25%.
4
1 _
= x ___
c. Use the ratio in part b to write and
4
860
solve a proportion.
4x = 860
x = 215
About 215 students at Erin’s school are between 62 and 66 inches tall.
exercises
Find the missing degree measure(s) in each pie chart.
_
1
1.
2.
3.
4
1 __
30°
60°
y°
18
x°
x°
x°
120°
y°
140°
80°
60°
4.
A tree farm sold Douglas, Spruce and Noble trees each year.
A random sampling of 200 purchases from the previous year
was used to plan for the following year’s
crop. The results are recorded in the pie
chart below.
Douglas
Spruce
50
50
a. Find P(Spruce).
Noble
b. Find P(Noble).
100
c. Find P(Douglas).
d. There are 2,000 purchases from the tree
farm each year. About how many Spruce trees are purchased each year?
92
Lesson 15 ~ Probabilities And Data Displays
ADVERTISEMENT
0 votes
Related Articles
Related forms


Related Categories
Parent category: Education