Percents And Probability Worksheet With Answers - Lesson 12-19 Page 21
ADVERTISEMENT
 1
1 2
2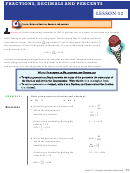 3
3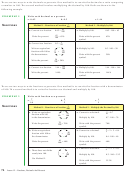 4
4 5
5 6
6 7
7 8
8 9
9 10
10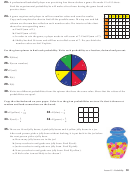 11
11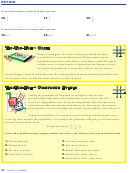 12
12 13
13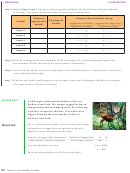 14
14 15
15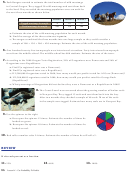 16
16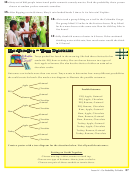 17
17 18
18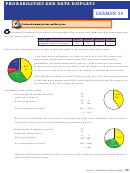 19
19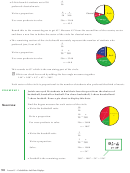 20
20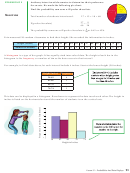 21
21 22
22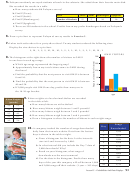 23
23 24
24 25
25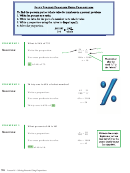 26
26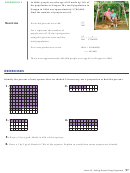 27
27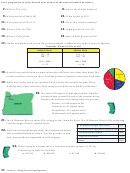 28
28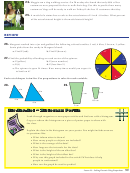 29
29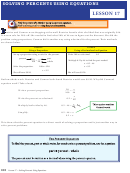 30
30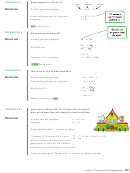 31
31 32
32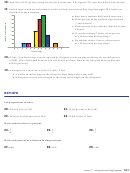 33
33 34
34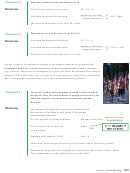 35
35 36
36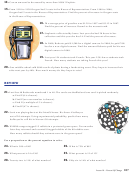 37
37 38
38 39
39 40
40 41
41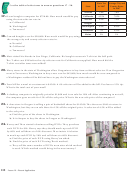 42
42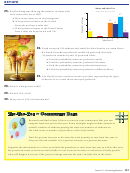 43
43 44
44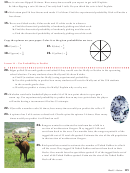 45
45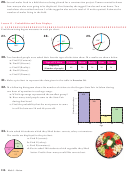 46
46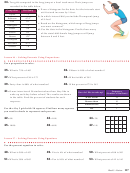 47
47 48
48 49
49Anthony interviewed classmates to determine their preference
examPle 2
for sweets. he made the following pie chart.
Hard
Find the probability someone will prefer chocolate.
Candy
Chocolate
15
27
s
Total number of students interviewed.
27 + 15 + 18 = 60
Chewy
olution
Candy
18
27 __
= 9 __
P(prefer chocolate)
60
20
9 __
Th e probability someone will prefer chocolate is
or 0.45 or 45%.
20
Erin measured 20 random classmates to fi nd their height. She recorded the information in inches.
height (inches)
58
59
60
61
62
63
64
65
66
67
68
69
70
71
72
73
number of students
1
0
3
2
1
0
0
4
2
0
4
1
0
1
1
0
histogram
A
is a type of bar graph. It has equally sized intervals of data. Th e height of each bar in the
frequency
histogram is the
or number of times the data occurs in that interval.
For example, in Erin’s data above, let each interval include 4 inches. Start at the lowest height (58 inches).
height (inches)
Frequency
58-62
6
62-66
5
66-70
7
70-74
2
Th is data can be displayed in a histogram. Bars drawn to represent the data touch each other. Th e height in
inches is listed on the horizontal axis and the number of students is on the vertical axis.
8
7
6
5
4
3
2
1
0
58
62
66
70
74
Height in Inches
91
Lesson 15 ~ Probabilities And Data Displays
ADVERTISEMENT
0 votes
Related Articles
Related forms


Related Categories
Parent category: Education