Percents And Probability Worksheet With Answers - Lesson 12-19 Page 2
ADVERTISEMENT
 1
1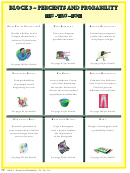 2
2 3
3 4
4 5
5 6
6 7
7 8
8 9
9 10
10 11
11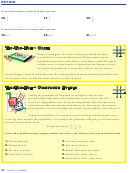 12
12 13
13 14
14 15
15 16
16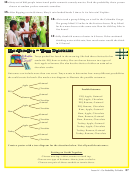 17
17 18
18 19
19 20
20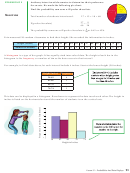 21
21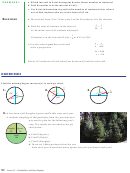 22
22 23
23 24
24 25
25 26
26 27
27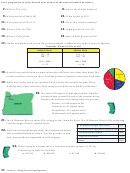 28
28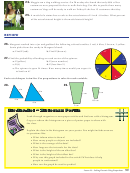 29
29 30
30 31
31 32
32 33
33 34
34 35
35 36
36 37
37 38
38 39
39 40
40 41
41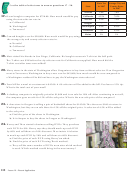 42
42 43
43 44
44 45
45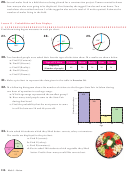 46
46 47
47 48
48 49
49BLoCK 3 ~ PerCents And ProBABILItY
tic - tac - tOe
t
d
h
P
s
t
i
?
ree
iAgrAms
itting
redictions
Ales
Ax or
ncome tAx
Use a tree diagram
Use batting averages to
Decide whether or not
to illustrate all
predict the number of
Oregon should have a
possible outcomes.
hits players will get.
sales tax. Defend your
point of view.
See page for details.
See page for details.
See page for details.
c
e
P
c
P
d
omPound
Vents
ie
hArt
ercent
iFFerence
Survey students. Create
Compare fi ve diff erent
Find probabilities
a pie chart displaying
item costs in two stores.
of multiple events
the results. Predict the
Find the percent
happening in a row.
choices the entire student
diff erence of each item.
population would make.
See page for details.
See page for details.
See page for details.
c
d
h
P
G
ommunity
AtA
istogrAm
oster
aMe
Research quantities in
Copy a histogram
Design a board game with
your community. Find the
onto a poster. Explain
a probability theme.
percent change from last
the importance
year to this year.
of the histogram.
See page for details.
See page for details.
See page for details.
72
Block 3 ~ Percents And Probability ~ Tic - Tac - Toe
ADVERTISEMENT
0 votes
Related Articles
Related forms


Related Categories
Parent category: Education