Percents And Probability Worksheet With Answers - Lesson 12-19 Page 19
ADVERTISEMENT
 1
1 2
2 3
3 4
4 5
5 6
6 7
7 8
8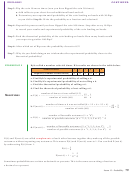 9
9 10
10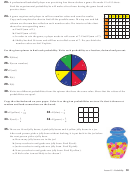 11
11 12
12 13
13 14
14 15
15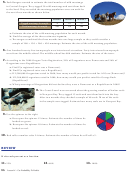 16
16 17
17 18
18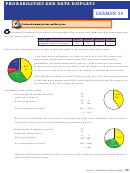 19
19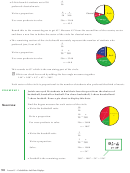 20
20 21
21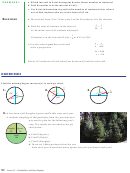 22
22 23
23 24
24 25
25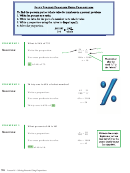 26
26 27
27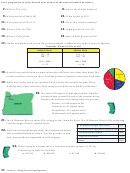 28
28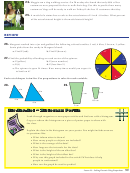 29
29 30
30 31
31 32
32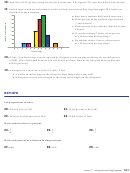 33
33 34
34 35
35 36
36 37
37 38
38 39
39 40
40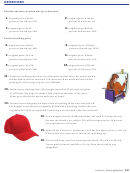 41
41 42
42 43
43 44
44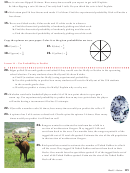 45
45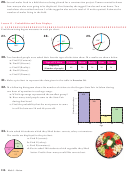 46
46 47
47 48
48 49
49PrOBaBilities and data disPlays
Lesson 15
O
livia asked 50 students at her school to choose which type of music they liked best. Th ey chose from rock,
country, classical and jazz.
Music type
rock
Country Classical
Jazz
Frequency (Number of Students)
20
15
6
9
Olivia put the information in a pie chart to show her results to the students in her music class.
pie chart
A
shows information as sectors, or slices, of a circle. Th e entire circle
must contain all the data. In other words, if the sectors are represented by
Jazz
probabilities, the probabilities need to sum to 1. If the sectors are represented
9
by percents, the percents need to sum to 100. In Olivia’s case she needs the amounts
Rock
in the sectors of the circle to sum to 50, the number of students she interviewed.
Classical
20
6
Country
How did Olivia make her pie chart? Th ere are 360° in a circle. She used proportions
15
to fi nd how many degrees out of 360° were needed for each sector. Th e degrees can
be measured in the circle using a protractor.
For example, look at Olivia’s data:
20 __
◆ Olivia found 20 students out of 50
Rock
50
preferred rock music.
144°
= x ___
20 __
Write a proportion.
50
360
Use cross products to solve.
50x = 7200
x = 144
Draw a vertical line from the center of the circle to the top of the circle and measure 144° to fi nd the
second line of the sector of the circle needed to represent rock music.
15 __
◆ Olivia found 15 students out of 50
50
preferred country music.
15 __
= x ___
Write a proportion.
Rock
50
360
108°
Use cross products to solve.
50x = 5400
Country
x = 108
Measure 108° from the second line of the rock music sector and draw a new line to defi ne the sector
of the circle for country music.
89
Lesson 15 ~ Probabilities And Data Displays
ADVERTISEMENT
0 votes
Related Articles
Related forms


Related Categories
Parent category: Education