Unit 1: Cost-Volume-Profit Analysis Economics Worksheet With Answers - Cma311s Notes, 2010 Page 14
ADVERTISEMENT
 1
1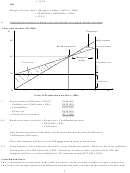 2
2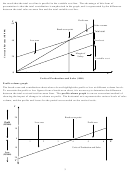 3
3 4
4 5
5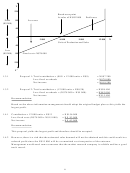 6
6 7
7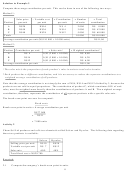 8
8 9
9 10
10 11
11 12
12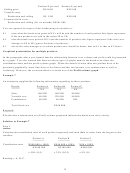 13
13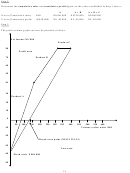 14
14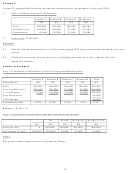 15
15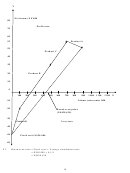 16
16 17
17 18
18 19
19 20
20 21
21 22
22 23
23 24
24 25
25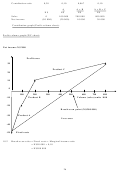 26
26 27
27Step 2:
Determine the cumulative sales and cumulative profit figures in the order established in Step 1 above:
A
A + B
A + B + C
X-axis (Cumulative sales)
N$0
N$160 000
N$320 000
N$400 000
Y-axis (Cumulative profit)
(N$40 000)
N$ 40 000
N$ 80 000
N$ 80 000
Step 3:
The profit-volume graph can now be plotted as follows:
Net income N$’000
Product C
80
Profit area
70
Product B
60
50
40
30
Product A
20
10
0
50
100
150
200
250
300
350
400
450
500
550
600
-10
Volume (sales) units ‘000
-20
Break-even point (N$133 333,33)
-30
Loss area
-40
Fixed costs N$40 000
-50
14
ADVERTISEMENT
0 votes
Related Articles
Related forms


Related Categories
Parent category: Education