Modeling And Writing Quadratic Equations Worksheet - Ms. Gallagher
ADVERTISEMENT
 1
1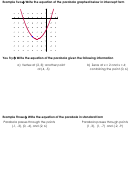 2
2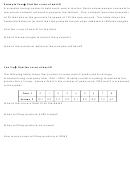 3
3Name______________________________
Date: _________________ Block:_______
Ms. Gallagher
Warm Up Using your calculator, find the line of best fit for the data
1. The data pairs (x,y) below give the population, y, in millions of Texas x years after
1997.
(0, 19.7), (1, 20.2), (2, 20.6), (3, 20.9), (4, 21.3), (5, 21.7), (6, 22.1), (7, 22.5)
a) What is the line of best fit for the data?
b) What does the y – intercept represent in the equation?
c) What does the slope represent in the equation?
d) What would you estimate the population of Texas to be today?
Notes Modeling and Writing Equations
Example One Write the equation of the parabola graphed below in vertex form
y
5
4
3
2
1
x
-2
-1
1
2
3
4
5
6
7
-1
-2
-3
ADVERTISEMENT
0 votes
Related Articles
Related forms


Related Categories
Parent category: Education