Lines Of Best Fit Using Slope-Intercept Form Worksheet - Algebra Chapter 4, Section 4.4 Page 2
ADVERTISEMENT
 1
1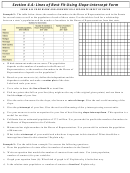 2
2Section 4.4: Lines of Best Fit Using Slope-Intercept Form
SHOW ALL YOUR WORK AND ANSWERS ON A SEPARATE SHEET OF PAPER
Example 2: The table below shows the number of members in the House of Representatives and in the Senate
for several states as well as the population of each of those states. Use the table to look for a relationship
between a state’s population and the number of members in the House of Representatives from that state.
a. Which statement makes more sense: The population
depends on the number of members in the House of
Representatives, or the number of members in the House of
Representatives depends on the population?
b. Based on your answer to (a), define the independent and the
dependent variables and make a scatter plot of the data.
Label and scale your axes.
c. Use a ruler to draw the line of best fit or trend line.
d. Pick two points that fall on your line (they might not be any of the original given points) and use them to
find the slope of your line.
e. Give the units of measure for the slope, also known as rate of change. Give the real-world meaning of the
slope.
f. Give the y-intercept of your line. Give the real-world meaning of the y-intercept using correct units.
g. Use your answers to write an equation for your line of best fit using slope-intercept form. This equation is a
model for our data.
h. California has an estimated population of 37.3 million. Use your model to predict the number of members in
the House of Representatives for California.
i. Minnesota has eight members in the House of Representatives. Use your model to estimate the population
of Minnesota.
j. What is the x-intercept of your model and what does it represent in this situation? What should the x-
intercept have been for this situation? Explain why.
Example 3: Use the table from example 2 to answer the following questions:
a. Does the population of a state affect its number of members in the Senate?
b. Write an equation that models the number of senators from each state. Use (state population,
number of senators) for your variables.
c. Graph your equation from (b). What kind of graph is it? Explain why it looks that way.
d. Is the relation state population vs. number of senators a function? Explain why.
ADVERTISEMENT
0 votes
Related Articles
Related forms


Related Categories
Parent category: Education