Lines Of Best Fit Using Slope-Intercept Form Worksheet - Algebra Chapter 4, Section 4.4
ADVERTISEMENT
 1
1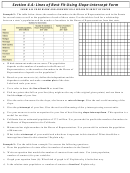 2
2Algebra
Name ________________________________________
CHAPTER 4
FUNCTIONS AND LINEAR MODELING
Period ______ Date ____________________________
Section 4.4: Lines of Best Fit Using Slope-Intercept Form
Example 1: This table shows how many grams of fat and how many calories there are in some hamburgers sold
by national chain restaurants.
a. Make a scatter plot of the data. Use (total fat, calories) for
your axes. Label and scale your axes.
b. Use a ruler to draw the line of best fit or trend line.
c. Pick two points that fall on your line (they might not be any of the original given points) and use them to
find the slope of your line.
d. Give the units of measure for the slope, also known as rate of change. Give the real-world meaning of the
slope.
e. Give the y-intercept of your line. Give the real-world meaning of the y-intercept using correct units.
f. Use your answers to write an equation for your line of best fit using slope-intercept form. This equation is a
model for our data.
g. Use your model to predict the calories in a burger with 80 grams of total fat.
h. Use your model to predict the total fat in a burger with 800 calories.
i. What is the x-intercept of your model and what does it represent in this situation?
ADVERTISEMENT
0 votes
Related Articles
Related forms


Related Categories
Parent category: Education