Mathematics Practice Test With Answer Key - Nebraska State Accountability - Grade 5 Page 12
ADVERTISEMENT
 1
1 2
2 3
3 4
4 5
5 6
6 7
7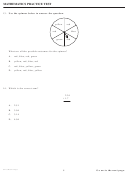 8
8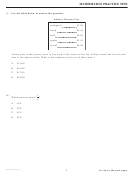 9
9 10
10 11
11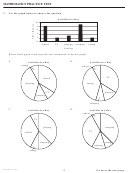 12
12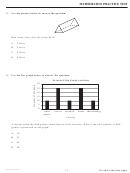 13
13 14
14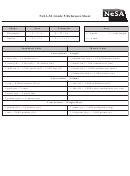 15
15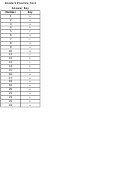 16
16MATHEMATICS PRACTICE TEST
21. Use the graph below to answer the question.
Activities in a Day
10
8
6
4
2
0
school
TV
playing sleeping
eating
Activity
Which circle graph could represent the information in the bar graph?
A.
B.
Activities in a Day
Activities in a Day
eating
school
TV
school
sleeping
eating
TV
playing
playing
sleeping
C.
D.
Activities in a Day
Activities in a Day
school
TV
playing
sleeping
TV
school
eating
sleeping
playing
eating
NEG5MathPTPaper
12
Go on to the next page.
ADVERTISEMENT
0 votes
Related Articles
Related forms


Related Categories
Parent category: Education