Histograms Worksheet Page 2
ADVERTISEMENT
 1
1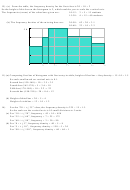 2
215) (a) From the table, the frequency density for the first class is 20 ÷ 10 = 2
So the height of this bar on the histogram is 2, which enables you to scale the vertical axis.
The frequencies (areas) of the other bars given are:
10-15: 3 × 5 = 15 students
15-30: 4 × 15 = 60 students
(b) The frequency desities of the missing bars are:
30-50: 62 ÷ 20 = 3.1
50-60: 23 ÷ 10 = 2.3
f. d.
4
3
2
1
x
10
20
30
40
50
60
11) (a) Comparing first bar of histogram with first entry in table, height of first bar = freq density = 15÷10 = 1.5
So each small mark on vertical axis is 0.1.
Second bar (150-160) = 10 × 3.5 = 35
Fourth bar (165-170) = 5 × 3.6 = 18
Fifth bar (170-180) = 10 × 2.2 -= 22
Seventh bar (190-210) = 20 × 0.6 = 12
(b) Height of third bar = 20 ÷ 5 = 4
Height of sixth bar = 12 ÷ 10 = 1.2
14)
For the “20 < t ≤ 35” class, the frequency density is 225 ÷ 15 = 15.
So the scale on the vertical axis is 10 small divisions to 5 units.
(a) For “10 < t ≤ 20”, frequency = 45 × 10 = 450
For “35 < t ≤ 60”, frequency = 7 × 25 = 175
For “60 < t ≤ 90”, frequency = 3 × 30 = 90
(b) For “0 < t ≤ 5”, frequency density = 40 ÷ 5 = 8
For “5 < t ≤ 10”, frequency density = 150 ÷ 5 = 30
For “90 < t ≤ 150”, frequency density = 60 ÷ 60 = 1
ADVERTISEMENT
0 votes
Related Articles
Related forms


Related Categories
Parent category: Education