Histograms Worksheet
ADVERTISEMENT
 1
1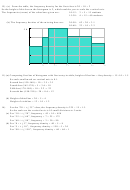 2
2Solutions to Past Paper Questions – Histograms
17) (a)
Time (t hrs) Class Width Frequency Frequency Density
0 < t ≤ 1
1
20
20
1 < t ≤ 2
1
28
28
2 < t ≤ 4
2
34
17
4 < t ≤ 8
4
52
13
8 < t ≤ 16
8
Scale the vertical axis so that the height of the first bar is 20. Draw other bars to correct heights as given by
the frequency density table above.
Freq Density
20
10
0
0
5
10
15
Time (hours)
(b) Height of the “8-16” bar is 3, so frequency = area of bar = 3 × 8 = 24
13) (a) From the table, the frequency density for the “20<t≤25” class is 15 ÷ 5 = 3
So the height of this bar on the histogram is 3, which enables you to scale the vertical axis.
The frequency densities of the missing bars are 1.6, 2.4 and 0.3
Freq Density
3
2
1
0
0
20
40
Time (seconds)
(b) From the table, the frequency density for the first class is 10 ÷ 10 = 1
So the height of this bar on the histogram is 1, which enables you to scale the vertical axis.
The frequencies (areas) of the other bars are 10 × 1.8 = 18, 5 × 2.8 = 14, 5 × 2 = 10 and 20 × 0.4 = 8
ADVERTISEMENT
0 votes
Related Articles
Related forms


Related Categories
Parent category: Education