Patterns And Relations Worksheet - Grade 7 Page 29
ADVERTISEMENT
 1
1 2
2 3
3 4
4 5
5 6
6 7
7 8
8 9
9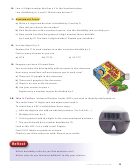 10
10 11
11 12
12 13
13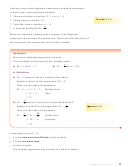 14
14 15
15 16
16 17
17 18
18 19
19 20
20 21
21 22
22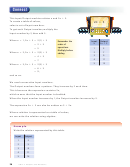 23
23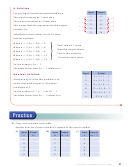 24
24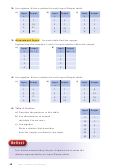 25
25 26
26 27
27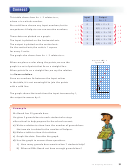 28
28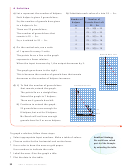 29
29 30
30 31
31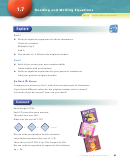 32
32 33
33 34
34 35
35 36
36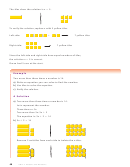 37
37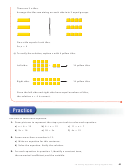 38
38 39
39 40
40 41
41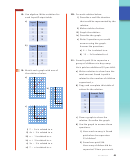 42
42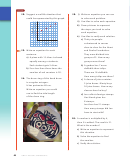 43
43 44
44 45
45 46
46A Solution
a) Let n represent the number of helpers.
b) Substitute each value of n into 25
3n.
Each helper is given 3 granola bars.
Number of
Number of
So, the number of granola bars given
Helpers
Granola Bars Left
n
25
3n
to n helpers is 3n.
0
25
3(0)
25
There are 25 granola bars.
The number of granola bars that
1
25
3(1)
22
remain is 25
3n.
2
25
3(2)
19
3
25
3(3)
16
So, n is related to 25
3n.
4
25
3(4)
13
c) On the vertical axis, use a scale
5
25
3(5)
10
of 1 square for every 2 units.
Granola Bars Left
The points lie on a line so the graph
26
represents a linear relation.
24
22
When the input increases by 1, the output decreases by 3.
20
18
16
The graph goes down to the right.
14
12
This is because the number of granola bars that remain
10
8
decreases as the number of helpers increases.
6
4
2
d) i) To find the number of granola bars
0 1 2 3
4 5
Granola Bars Left
Number of
that remain, extend the graph.
Helpers
1
26
3
24
The points lie on a straight line.
22
20
Extend the graph to 7 helpers.
18
16
There are 4 granola bars left.
14
12
ii) Continue to extend the graph.
10
8
25 granola bars are enough for
6
7 helpers
4
8 helpers, but not for 9 helpers.
2
8 helpers
Mr. Beach will not have enough
0 1 2 3
4 5 6 7 8 9
Number of Helpers
granola bars for 9 or more helpers.
To graph a relation, follow these steps:
•
Another Strategy
Select appropriate Input numbers. Make a table of values.
We could have solved
•
Choose scales for the horizontal and vertical axes.
part d of the Example
•
Use a ruler to draw the axes on grid paper.
by extending the table.
Use numbers to indicate the scale.
•
Label the axes. Give the graph a title.
•
Plot the data in the table.
32
UNIT 1: Patterns and Relations
ADVERTISEMENT
0 votes
Related Articles
Related forms


Related Categories
Parent category: Education