Patterns And Relations Worksheet - Grade 7 Page 28
ADVERTISEMENT
 1
1 2
2 3
3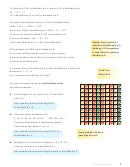 4
4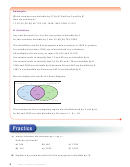 5
5 6
6 7
7 8
8 9
9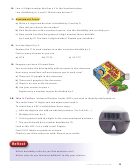 10
10 11
11 12
12 13
13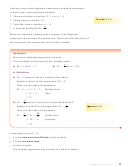 14
14 15
15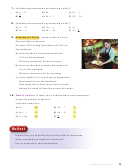 16
16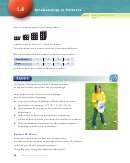 17
17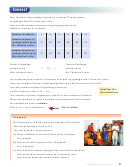 18
18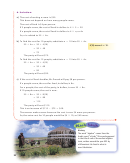 19
19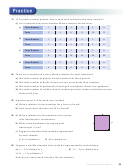 20
20 21
21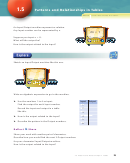 22
22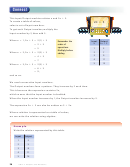 23
23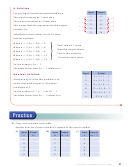 24
24 25
25 26
26 27
27 28
28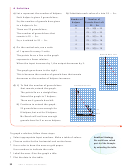 29
29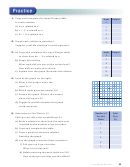 30
30 31
31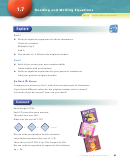 32
32 33
33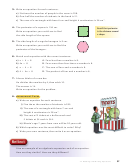 34
34 35
35 36
36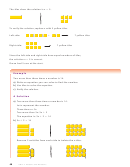 37
37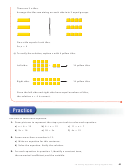 38
38 39
39 40
40 41
41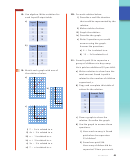 42
42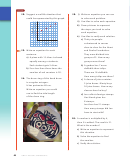 43
43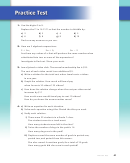 44
44 45
45 46
46Input
Output
This table shows how 4n
2 relates to n,
n
4n
2
where n is a whole number.
0
4(0)
2
2
We could have chosen any Input numbers, but to
4
1
1
4(1)
2
6
see patterns it helps to use consecutive numbers.
4
1
2
4(2)
2
10
4
1
These data are plotted on a graph.
3
4(3)
2
14
4
1
4
4(4)
2
18
The input is plotted on the horizontal axis.
4
1
5
4(5)
2
22
The output is plotted on the vertical axis.
On the vertical axis, the scale is 1 square
for every 2 units.
The graph also shows how 4n
2 relates to n.
Graph of 4 n
2
When we place a ruler along the points, we see the
against n
graph is a set of points that lie on a straight line.
24
22
When points lie on a straight line, we say the relation
20
18
is a linear relation.
16
14
Since no numbers lie between the Input values
12
10
in the table, it is not meaningful to join the points
8
6
with a solid line.
4
4
2
1
The graph shows that each time the input increases by 1,
0 1 2 3
4 5
Input
the output increases by 4.
Example
Mr. Beach has 25 granola bars.
He gives 3 granola bars to each student who stays
after school to help prepare for the school concert.
a) Write a relation to show how the number of granola bars
that remain is related to the number of helpers.
b) Make a table to show this relation.
c) Graph the data. Describe the graph.
d) Use the graph to answer these questions:
i) How many granola bars remain when 7 students help?
ii) When will Mr. Beach not have enough granola bars?
31
1.6 Graphing Relations
ADVERTISEMENT
0 votes
Related Articles
Related forms


Related Categories
Parent category: Education