Patterns And Relations Worksheet - Grade 7 Page 27
ADVERTISEMENT
 1
1 2
2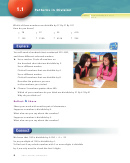 3
3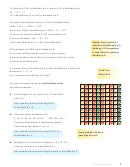 4
4 5
5 6
6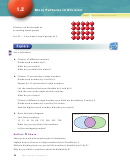 7
7 8
8 9
9 10
10 11
11 12
12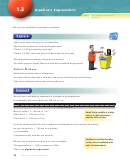 13
13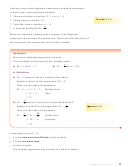 14
14 15
15 16
16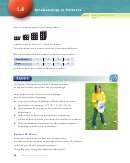 17
17 18
18 19
19 20
20 21
21 22
22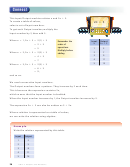 23
23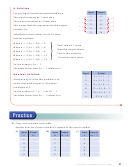 24
24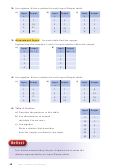 25
25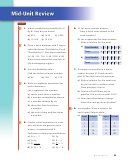 26
26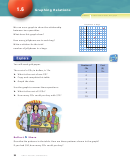 27
27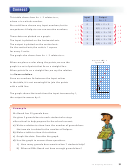 28
28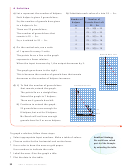 29
29 30
30 31
31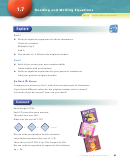 32
32 33
33 34
34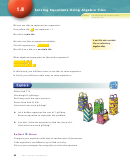 35
35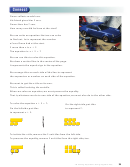 36
36 37
37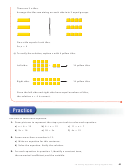 38
38 39
39 40
40 41
41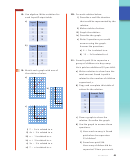 42
42 43
43 44
44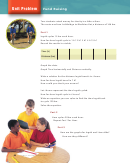 45
45 46
461.6
Graphing Relations
Focus
Create a table of values, then graph.
Jellybeans in Bags
We can use a graph to show the relationship
120
between two quantities.
90
What does this graph show?
60
How many jellybeans are in each bag?
30
Write a relation for the total
number of jellybeans in n bags.
0
1
2
3
4
Number of Bags
You will need grid paper.
Number of
Cost
CDs
($)
The cost of n CDs, in dollars, is 12n.
n
12 n
➤ What is the cost of one CD?
0
➤ Copy and complete this table.
2
➤ Graph the data.
4
Use the graph to answer these questions:
6
➤ What is the cost of 5 CDs?
8
➤ How many CDs could you buy with $72?
10
&
Reflect
Share
Describe the patterns in the table. How are these patterns shown in the graph?
If you had $50, how many CDs could you buy?
30
UNIT 1: Patterns and Relations
ADVERTISEMENT
0 votes
Related Articles
Related forms


Related Categories
Parent category: Education