Graphs Of Linear Inequalities Worksheet With Answers Page 9
ADVERTISEMENT
 1
1 2
2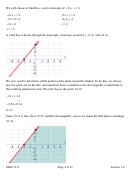 3
3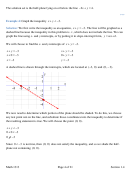 4
4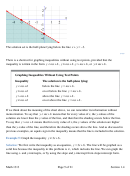 5
5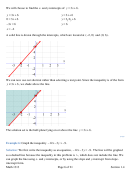 6
6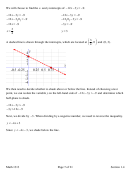 7
7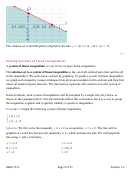 8
8 9
9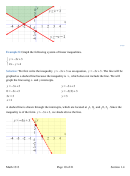 10
10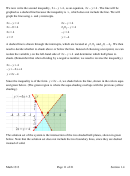 11
11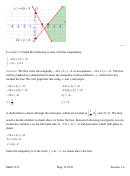 12
12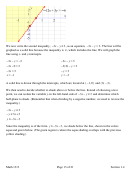 13
13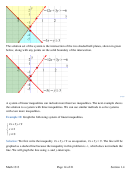 14
14 15
15 16
16 17
17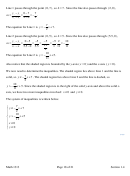 18
18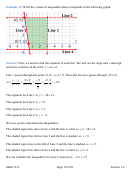 19
19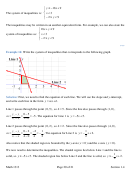 20
20 21
21(
)
(
)
A solid line is drawn through the intercepts, which are located at
−
2, 0
and
0, 2 . Since the
inequality is of the form
y
≥ + , we shade above the line.
x
2
We now write the second inequality,
y
≥ − − , as an equation,
x
2
y
= − − . The line will be
x
2
graphed as a solid line because the inequality is ≥ , which includes the line. We will graph the
line using x- and y-intercepts.
y
= −
x
2
y
= −
x
2
0
= − −
x
2
y
= −
0 2
x
= −
2
y
= −
2
(
)
(
)
A solid line is drawn through the intercepts, which are located at
−
2, 0
and
0, 2
−
. Since the
inequality is of the form
y
≥ − − , we shade above the line, shown in the colors aqua and green
x
2
below. (The green region is where the aqua shading overlaps with the previous yellow shading.)
The solution set of the system is the intersection of the two shaded half-planes, shown in green
below, along with any points on the boundary of the shaded region.
Math 1313
Page 9 of 21
Section 1.4
ADVERTISEMENT
0 votes
Related Articles
Related forms


Related Categories
Parent category: Education