Graphs Of Linear Inequalities Worksheet With Answers Page 8
ADVERTISEMENT
 1
1 2
2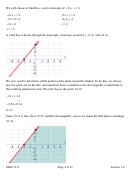 3
3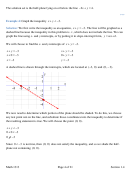 4
4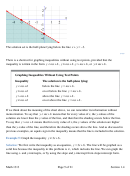 5
5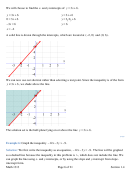 6
6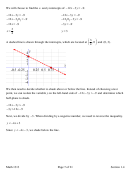 7
7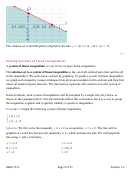 8
8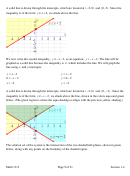 9
9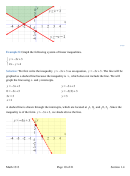 10
10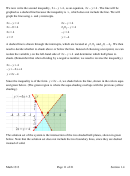 11
11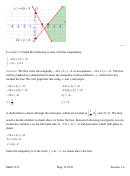 12
12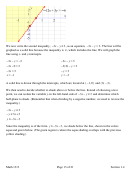 13
13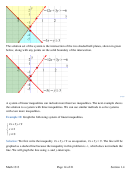 14
14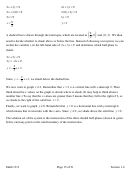 15
15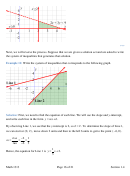 16
16 17
17 18
18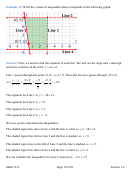 19
19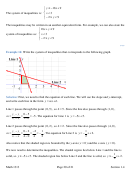 20
20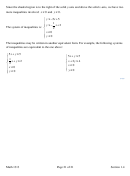 21
21The solution set is the half-plane lying below the line
y
= −
4
x
+
3
or 12
−
x
−
3
y
= − .
9
***
Solving Systems of Linear Inequalities
A system of linear inequalities is a set of two or more linear inequalities.
The solution set to a system of linear inequalities is the set of all ordered pairs that satisfies all
of the inequalities. We solve these systems by graphing. To graph a system of linear inequalities,
we graph each inequality (using techniques from previous examples in this section) and then find
where all shaded regions intersect. The intersection represents the solution set to the system of
inequalities.
In this textbook, each system of inequalities will be preceded by a single left curly brace, as
shown in the examples below. Not all textbooks follow this convention, but it is a way to group
the inequalities together and to quickly identify a system of inequalities.
Example 7:
Graph the following system of linear inequalities.
y
≥ +
x
2
y
≥ − −
x
2
Solution:
We first write the inequality
y
≥ +
x
2
as an equation,
y
= + . The line will be
x
2
graphed as a solid line because the inequality is ≥ , which includes the line. We will graph the
line using x- and y-intercepts.
y
= +
x
2
y
= +
x
2
0
= +
x
2
y
= +
0 2
x
= −
2
y
=
2
Math 1313
Page 8 of 21
Section 1.4
ADVERTISEMENT
0 votes
Related Articles
Related forms


Related Categories
Parent category: Education