Graphs Of Linear Inequalities Worksheet With Answers Page 5
ADVERTISEMENT
 1
1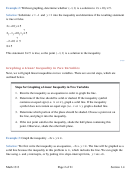 2
2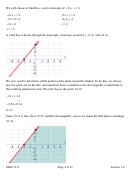 3
3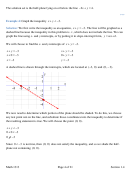 4
4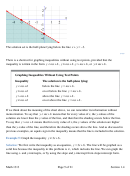 5
5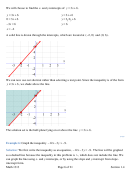 6
6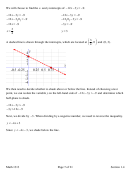 7
7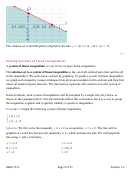 8
8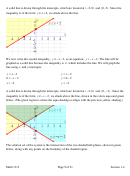 9
9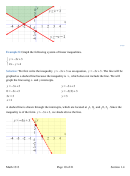 10
10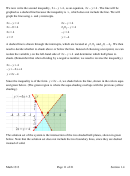 11
11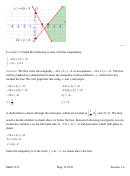 12
12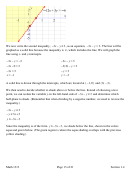 13
13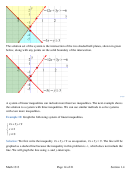 14
14 15
15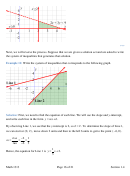 16
16 17
17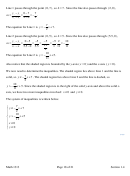 18
18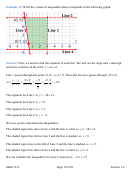 19
19 20
20 21
21The solution set is the half-plane lying below the line
+ = − .
3
x y
***
There is a shortcut for graphing inequalities without using test points, provided that the
inequality is written in the form y mx b
<
+ , y mx b
≤
+ , y mx b
>
+ , or y mx b
≥
+ .
Graphing Inequalities Without Using Test Points
Inequality
The solution is the half-plane lying:
below the line y mx b
+ .
y mx b
<
+
=
y mx b
≤
+
on or below the line y mx b
=
+ .
y mx b
>
+
above the line y mx b
=
+ .
y mx b
≥
+
on or above the line y mx b
=
+ .
If we think about the meaning of the chart above, we can remember its information without
memorization. To say that y mx b
<
+
means that for every value of x, the y-values of the
solution are lower than the y-value of the line, and therefore the shading occurs below the line.
To say that y mx b
>
+ means that for every value of x, the y-values of the solution are higher
than the y-value of the line, and therefore the shading occurs above the line. And as discussed in
previous examples, an equals sign in the inequality means that the line is included in the solution.
Example 5:
Graph the inequality
y
≥
3
x
+ .
6
Solution:
We first write the inequality as an equation,
y
=
3
x
+ . The line will be graphed as a
6
solid line because the inequality in this problem is ≥ , which includes the line. We can graph the
line using x- and y-intercepts, or by using the slope and y-intercept from slope-intercept form.
Math 1313
Page 5 of 21
Section 1.4
ADVERTISEMENT
0 votes
Related Articles
Related forms


Related Categories
Parent category: Education