Graphs Of Linear Inequalities Worksheet With Answers Page 2
ADVERTISEMENT
 1
1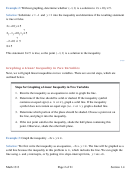 2
2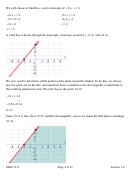 3
3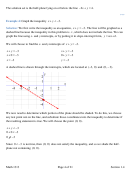 4
4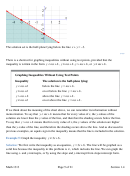 5
5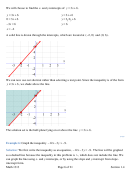 6
6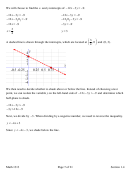 7
7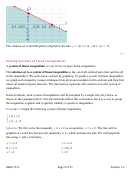 8
8 9
9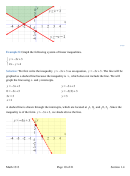 10
10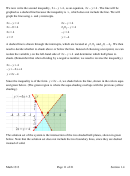 11
11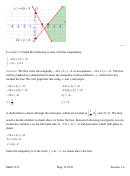 12
12 13
13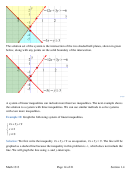 14
14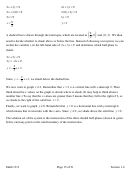 15
15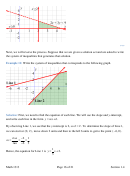 16
16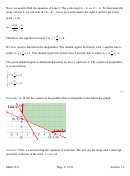 17
17 18
18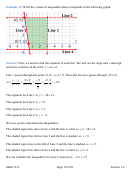 19
19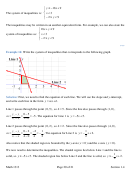 20
20 21
21Example 2:
Without graphing, determine whether ( 1, 1)
−
is a solution to 2
x
+
10
y
≥ .
5
Solution:
Substitute
x = − and
1
y = into the inequality and determine if the resulting statement
1
is true or false.
2
x
+
10
y
≥
5
?
( )
( )
2
− +
1
10 1
≥
5
?
− +
2 10
≥
5
8 5
≥
(
)
This statement 8 5
≥
is true, so the point
−
1,1
is a solution to the inequality.
***
Graphing a Linear Inequality in Two Variables
Next, we will graph linear inequalities in two variables. There are several steps, which are
outlined below.
Steps for Graphing a Linear Inequality in Two Variables
1. Rewrite the inequality as an equation in order to graph the line.
2. Determine if the line should be solid or dashed. If the inequality symbol
contains an equal sign (i.e. ≤ or ≥ ), graph a solid line. If the inequality
symbol does not contain an equal sign (i.e. < or > ), graph a dashed line.
3. Determine which portion of the plane should be shaded. Choose a point not on
the line, and plug it into the inequality.
4. If the test point satisfies the inequality, shade the half-plane containing this
point. Otherwise, shade the other half-plane.
Example 3:
Graph the inequality 2
−
x y
+ ≤ .
4
Solution:
We first write the inequality as an equation, 2
−
x y
+ = . The line will be graphed as a
4
solid line because the inequality in this problem is ≤ , which includes the line. We can graph the
line using x- and y-intercepts, or by putting it in slope-intercept form, y mx b
=
+ .
Math 1313
Page 2 of 21
Section 1.4
ADVERTISEMENT
0 votes
Related Articles
Related forms


Related Categories
Parent category: Education