Graphs Of Linear Inequalities Worksheet With Answers Page 18
ADVERTISEMENT
 1
1 2
2 3
3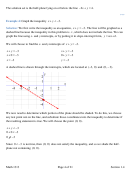 4
4 5
5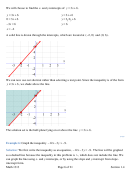 6
6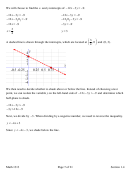 7
7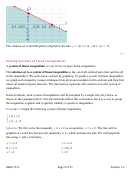 8
8 9
9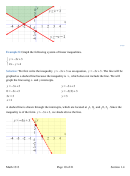 10
10 11
11 12
12 13
13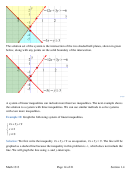 14
14 15
15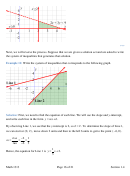 16
16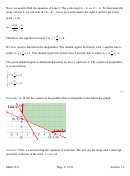 17
17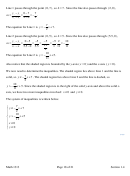 18
18 19
19 20
20 21
21(
)
(
)
Line 1 passes through the point
0, 7 , so
b = . Since the line also passes through
7
2, 0 ,
y
−
y
0 7
−
7
2
1
m
=
=
= −
.
2 0
2
x
−
x
−
2
1
7
The equation for Line 1 is
y
x
+ .
7
= −
2
(
)
(
)
Line 2 passes through the point
0, 5 , so
b = . Since the line also passes through
5
5.5, 0 ,
y
−
y
0 5
−
−
5
−
5
−
5 2
10
2
1
m
=
=
=
=
=
⋅
= −
11
x
−
x
5.5 0
−
5.5
1 11
11
2
1
2
10
The equation for Line 2 is
+ .
5
y
= −
x
11
Also notice that the shaded region is bounded by the y-axis (
x = ) and the x-axis (
0
y = ).
0
We now need to determine the inequalities. The shaded region lies above Line 1 and the line is
7
solid, so
y
≥ −
x
+ . The shaded region lies above Line 2 and the line is dashed, so
7
2
10
y
> −
x
+ . Since the shaded region is to the right of the solid y-axis and above the solid x-
5
11
axis, we have two more inequalities involved:
0
and
y ≥ .
0
x ≥
The system of inequalities is written below.
7
y
≥ −
x
+
7
2
10
y
x
5
> −
+
11
x
≥
0
y
≥
0
***
Math 1313
Page 18 of 21
Section 1.4
ADVERTISEMENT
0 votes
Related Articles
Related forms


Related Categories
Parent category: Education