Graphs Of Linear Inequalities Worksheet With Answers Page 17
ADVERTISEMENT
 1
1 2
2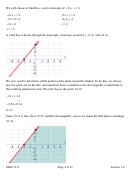 3
3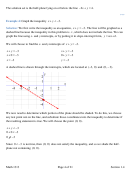 4
4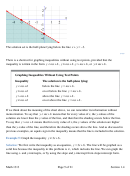 5
5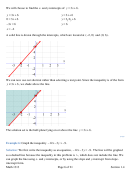 6
6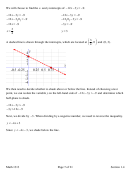 7
7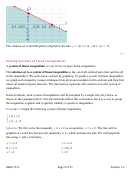 8
8 9
9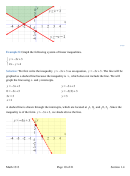 10
10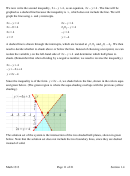 11
11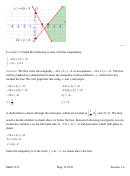 12
12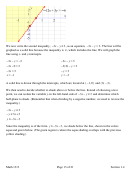 13
13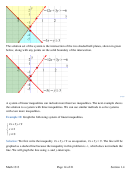 14
14 15
15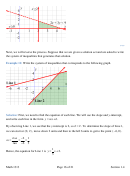 16
16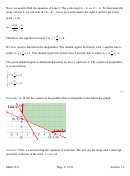 17
17 18
18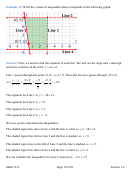 19
19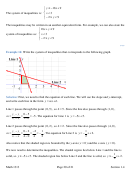 20
20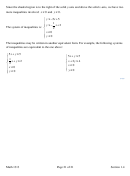 21
21Next, we need to find the equation of Line 2. The y-intercept is 4 − , so
b = − . To determine the
4
(
)
slope of Line 2, we can start at
0, 4
, move up 4 units and to the right 3 units to get to the
−
(
)
point
3, 0 .
rise
4
m =
=
run
3
4
Therefore, the equation for Line 2 is
y
=
x
− .
4
3
We now need to determine the inequalities. The shaded region lies below Line 1 and the line is
1
4
solid, so
y
≤
x
+ . The shaded region lies below Line 2 and the line is solid, so
2
y
≤
x
− .
4
3
3
The green shaded region is determined entirely by Line 1 and Line 2. The system of inequalities
is written below.
1
2
y
≤
x
+
3
4
y
x
4
≤
−
3
***
Example 12:
Write the system of inequalities that corresponds to the following graph.
Solution:
First, we need to find the equation of each line. We will use the slope and y -intercept,
and write each line in the form y mx b
=
+ .
Math 1313
Page 17 of 21
Section 1.4
ADVERTISEMENT
0 votes
Related Articles
Related forms


Related Categories
Parent category: Education