Graphs Of Linear Inequalities Worksheet With Answers Page 15
ADVERTISEMENT
 1
1 2
2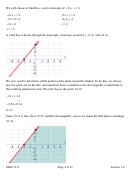 3
3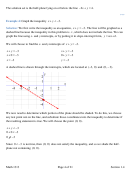 4
4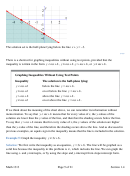 5
5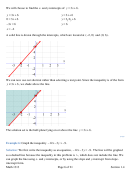 6
6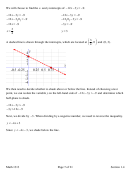 7
7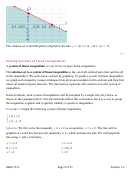 8
8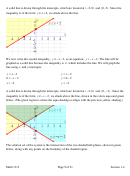 9
9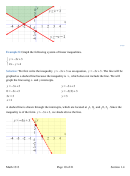 10
10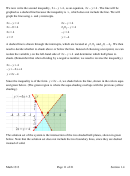 11
11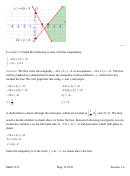 12
12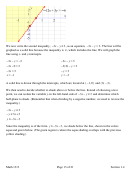 13
13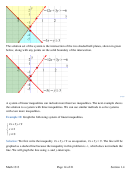 14
14 15
15 16
16 17
17 18
18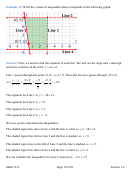 19
19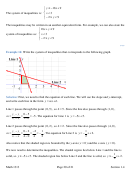 20
20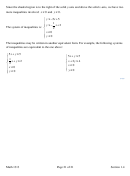 21
212
x
+
3
y
=
9
2
x
+
3
y
=
9
( )
( )
2
x
+
3 0
=
9
2 0
+
3
y
=
9
2
x
9
3
y
9
=
=
9
x
=
y
=
3
2
9
(
)
A dashed line is drawn through the intercepts, which are located at
and
0, 3 . We then
, 0
2
need to decide whether to shade above or below the line. Instead of choosing a test point, we can
isolate the variable y on the left-hand side of 2
x
+
3
y
<
9
and determine which half-plane to
shade.
2
x
+
3
y
<
9
3
y
< −
2
x
+
9
2
y
< −
x
+
3
3
2
Since
y
< −
x
+ , we shade below the dashed line.
3
3
We now want to graph
x ≥ . Remember that
2
x =
2
is a vertical line with x-intercept 2. Then
think about the x-values on the graph to decide where to shade. (It may help to think about a
number line.) To say that the x-values are greater than 2 means that they fall to the right of 2, so
we shade to the right of the solid line
x = .
2
Finally, we want to graph
y ≥ . Remember that
0
y =
0
is a horizontal line with y-intercept 0,
which means that it coincides with the x-axis. Since
y ≥ , we shade above the solid line
0
y = .
0
The solution set of the system is the intersection of the three shaded half-planes (shown in green
below) and any point on the solid boundary of the intersection.
Math 1313
Page 15 of 21
Section 1.4
ADVERTISEMENT
0 votes
Related Articles
Related forms


Related Categories
Parent category: Education