Graphs Of Linear Inequalities Worksheet With Answers Page 11
ADVERTISEMENT
 1
1 2
2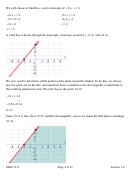 3
3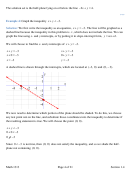 4
4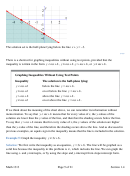 5
5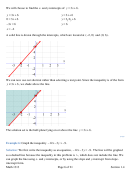 6
6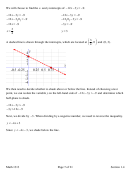 7
7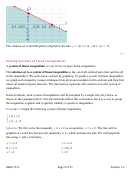 8
8 9
9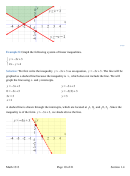 10
10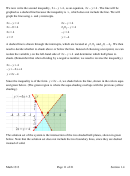 11
11 12
12 13
13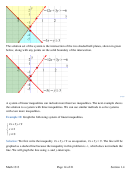 14
14 15
15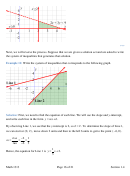 16
16 17
17 18
18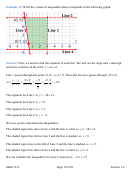 19
19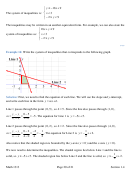 20
20 21
21We now write the second inequality, 2
x y
− > , as an equation, 2
4
x y
− = . The line will be
4
graphed as a dashed line because the inequality is > , which does not include the line. We will
graph the line using x- and y-intercepts.
2
x y
− =
4
2
x y
− =
4
( )
2
x
− =
0 4
2 0
− =
y
4
2
x
=
4
− =
y
4
x
=
2
y
= −
4
(
)
(
)
A dashed line is drawn through the intercepts, which are located at
2, 0 and
0, 4
−
. We then
need to decide whether to shade above or below the line. Instead of choosing a test point, we can
isolate the variable y on the left-hand side of 2
x y
4
and determine which half-plane to
− >
shade. (Remember that when dividing by a negative number, we need to reverse the inequality.)
2
x y
− >
4
− > −
y
2
x
+
4
y
<
2
x
−
4
Since the inequality is of the form
y
2
x
− , we shade below the line, shown in the colors aqua
4
<
and green below. (The green region is where the aqua shading overlaps with the previous yellow
shading.)
The solution set of the system is the intersection of the two shaded half-planes, shown in green
below. Note that the solution set does not include the two boundary lines, since they are dashed
instead of solid.
Math 1313
Page 11 of 21
Section 1.4
ADVERTISEMENT
0 votes
Related Articles
Related forms


Related Categories
Parent category: Education