Graphs Of Linear Inequalities Worksheet With Answers
ADVERTISEMENT
 1
1 2
2 3
3 4
4 5
5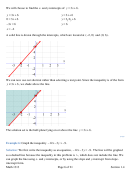 6
6 7
7 8
8 9
9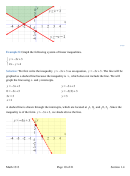 10
10 11
11 12
12 13
13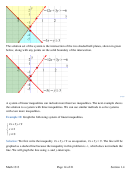 14
14 15
15 16
16 17
17 18
18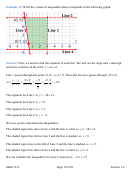 19
19 20
20 21
21Section 1.4 – Graphs of Linear Inequalities
A Linear Inequality and its Graph
A linear inequality has the same form as a linear equation, except that the equal symbol is
replaced with any one of ≤ , ≥ , < , or > .
The solution set to an inequality in two variables is the set of all ordered pairs that satisfies the
inequality, and is best represented by its graph. The graph of a linear inequality is represented by
a straight or dashed line and a shaded half-plane. An illustration is shown below.
Example 1:
Without graphing, determine whether ( 3, 7)
− −
is a solution to
y
> − .
x
4
Solution:
Substitute
x = − and
3
y = − into the inequality and determine if the resulting
7
statement is true or false.
y
> −
x
4
?
− > − −
7
3 4
− >
7
−
7
(
)
This statement 7
− > − is false, so the point
7
− −
3, 7
is not a solution to the inequality.
***
Math 1313
Page 1 of 21
Section 1.4
ADVERTISEMENT
0 votes
Related Articles
Related forms


Related Categories
Parent category: Education