Misleading Histograms - Math Worksheet With Answers
ADVERTISEMENT
 1
1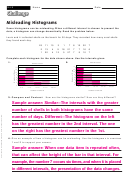 2
22–15
Name
Date
Misleading Histograms
Some histograms can be misleading. When a different interval is chosen to present the
data, a histogram can change dramatically. Read the problem below.
Louis and Li collected shells on the beach for 30 days. They recorded how many coral shells
they found each day.
25 11 15
3
1
7 8 10 32 7
2 13
4
9 18 21 7
7 16 6
1 22
4 12
5 27 7
9 10 7
Complete each histogram for the data shown above. Use the intervals given.
1.
2.
Shells Found
Shells Found
14
14
12
12
10
10
8
8
6
6
4
4
2
2
0
0
0–7
8–15
16–23
24–31
32–39
0–6
7–13
14–20
21–27
28–34
Number of Shells
Number of Shells
Compare and Contrast How are the histograms similar? How are they different?
3.
Give an example of how a histogram can be misleading. Use the histograms in exercises
4.
1 and 2 to support your answer.
ADVERTISEMENT
0 votes
Related Articles
Related forms


Related Categories
Parent category: Education