Histogram Worksheet With Answers Page 2
ADVERTISEMENT
 1
1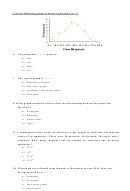 2
2 3
3 4
4* Use the following graph to answer questions (6 - 7)
6. The graph has ……… peak(s).
a) four
b) one
c) three
d) two
7. The type of graph is ………
a) frequency polygon
b) time series graph
c) cumulative frequency graph
d) histogram
8. What graph should be used to show the relationship between the parts and
the whole?
a) Histogram
b) Pie graph
c) Pareto chart
d) Ogive
9. A department store wants to construct a pie graph to represent the marital
status of its employees. There were 30 married, 10 divorced, 20 single, and 5
widowed. How many degrees will be needed to represent the divorced
employees?
a) 41.6⁰
b) 10⁰
c) 55.4⁰
d) 15.4⁰
10. When data are collected from January to December in year 2011, they can
be represented by a ………
a) histogram
b) pie graph
c) time series graph
d) pareto chart
ADVERTISEMENT
0 votes
Related Articles
Related forms


Related Categories
Parent category: Education