Histograms Practice Worksheet Page 4
ADVERTISEMENT
 1
1 2
2 3
3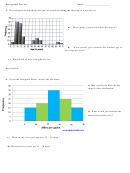 4
4Histograms
P ractice
N ame:
_ __________________________
5. The histogram below shows the ages of people attending the showing of a new movie.
a)
How many people attended the movie?
b)
What would you estimate the median age of
moviegoers to be?
c) What kind of movie might this be?
Explanation:
6. Given the histogram below, answer the questions:
a) How would you describe the
shape of this distribution?
b) What would you estimate the
mean and median to be?
c) How many cars get between 25 – 30 mpg?
d) What percent of cars get 15 – 20 mpg?
ADVERTISEMENT
0 votes
Related Articles
Related forms


Related Categories
Parent category: Education