Histograms Practice Worksheet Page 2
ADVERTISEMENT
 1
1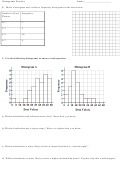 2
2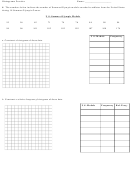 3
3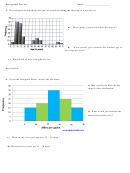 4
4Histograms
P ractice
N ame:
_ __________________________
2. Make a histogram and a relative frequency histogram for the data below:
Number of Free
Frequency
Throws
0-1
1
2-3
5
4-5
10
6-7
4
3. Use the following histograms to answer each question
a) Which distribution had collected more data? Show how you know.
b) Which distribution has a larger range? Show or explain how you know.
c) Which distribution is more likely to have a shape described as “skewed right?”
d) Which distribution is more likely to have a higher median than mean? Explain why this would happen.
ADVERTISEMENT
0 votes
Related Articles
Related forms


Related Categories
Parent category: Education