Histograms Worksheet Page 8
ADVERTISEMENT
 1
1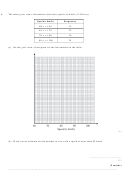 2
2 3
3 4
4 5
5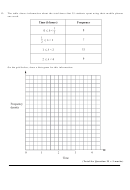 6
6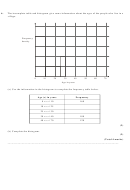 7
7 8
87.
The table shows the distribution of the ages of passengers travelling on a plane from London
to Belfast.
Age (x years)
Frequency
0 < x 20
28
20 < x 35
36
35 < x 45
20
45 < x 65
30
On the grid below, draw a histogram to show this distribution.
0
10
20
30
40
50
60
70
Age ( years)
x
(Total 3 marks)
______________________________________________
_____________________________
ADVERTISEMENT
0 votes
Related Articles
Related forms


Related Categories
Parent category: Education