Histograms Worksheet Page 3
ADVERTISEMENT
 1
1 2
2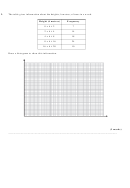 3
3 4
4 5
5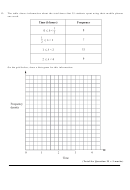 6
6 7
7 8
82.
The table gives information about the heights, h metres, of trees in a wood.
Height (h metres)
Frequency
0 < h 2
7
2 < h 4
14
4 < h 8
18
8 < h 16
24
16 < h 20
10
Draw a histogram to show this information.
(3 marks)
______________________________________________________________________________
ADVERTISEMENT
0 votes
Related Articles
Related forms


Related Categories
Parent category: Education