Histograms Worksheet Page 2
ADVERTISEMENT
 1
1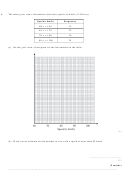 2
2 3
3 4
4 5
5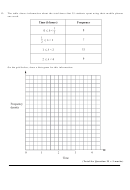 6
6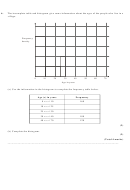 7
7 8
81.
The table gives some information about the speeds, in km/h, of 100 cars.
Speed(s km/h)
Frequency
60 < s 65
15
65 < s 70
25
70 < s 80
36
80 < s 100
24
(a) On the grid, draw a histogram for the information in the table.
(3)
(b) Work out an estimate for the number of cars with a speed of more than 85 km/h.
..............................................
(2)
(5 marks)
______________________________________________________________________________
ADVERTISEMENT
0 votes
Related Articles
Related forms


Related Categories
Parent category: Education