Histograms Worksheet With Answers Page 3
ADVERTISEMENT
 1
1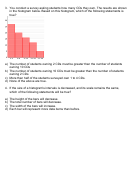 2
2 3
3Answers:
1. C — 20
Explanation: 20 students own 11 to 15 CDs. The height of a histogram bar indicates the
frequency of data items in that interval. The bar that represents 11–15 CDs has a height of
20, therefore there are 20 students that own 11 to 15 CDs.
2. B — 3–5 CDs
Explanation: The interval with the greatest frequency would be 3–5 CDs. From the survey
results, 7 students have 3 CDs, 5 students have 4 CDs, and 7 students have 5 CDs.
Therefore, 19 students have between 3 and 5 CDs. The other intervals have lower
frequencies.
3. D — None of the above are true.
Explanation: None of the above are true. Although the interval 1–4 has 27 data items and
the interval 9–12 only has 16, this does not necessarily mean that more students own
exactly 2 CDs than own exactly 10 CDs. For example, it is possible that no students own
exactly 2 CDs. It is also not correct to conclude that more than half of the students own 1–4
CDs. Although this is the most frequently occurring interval, there are only 27 students in it.
The other intervals have a combined total of 53 students.
4. A — The height of the bars will decrease.
Explanation: If the size of a histogram's intervals is decreased, and its scale remains the
same, the height of the bars will decrease. When the intervals become smaller in size,
there will be more histogram bars for a given range of data, but there will also be fewer
data items within each interval. Since the bars' height represents the number of items in
each interval, reducing the interval size will also reduce the height of the histograms' bars.
ADVERTISEMENT
0 votes
Related Articles
Related forms


Related Categories
Parent category: Education