Physical Setting - Science Worksheet Page 14
ADVERTISEMENT
 1
1 2
2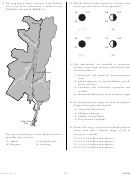 3
3 4
4 5
5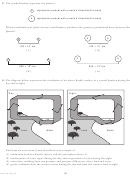 6
6 7
7 8
8 9
9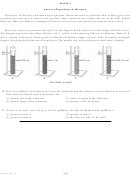 10
10 11
11 12
12 13
13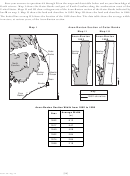 14
14 15
15 16
16 17
17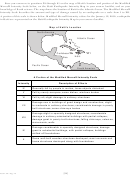 18
18 19
19 20
20 21
21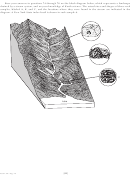 22
22 23
23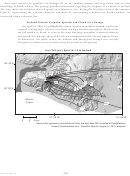 24
24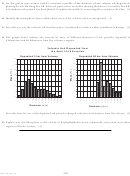 25
25 26
26 27
27 28
28Base your answers to questions 48 through 50 on the maps and data table below and on your knowledge of
Earth science. Map I shows the Outer Banks and part of North Carolina along the southeastern coast of the
United States. Maps II and III show enlargements of the Avon-Buxton section of the Outer Banks indicated by
box X on map I. Map II shows the land and shoreline in 1852. Map III shows the land and shoreline in 1998.
The dotted line on map III shows the location of the 1852 shoreline. The data table shows the average width,
in meters, at various years, of the Avon-Buxton section.
Map I
Avon-Buxton Section of Outer Banks
Map II
Map III
Avon-Buxton
Avon-Buxton
1852
1998
North
Carolina
Pamlico
Pamlico
Outer
Sound
Sound
Banks
North
Ocean
Carolina
Atlantic
Pamlico
Ocean
Sound
N
Avon
Buxton
X
Key
N
Core
Banks
1852 shoreline
Avon-Buxton Section Width from 1852 to 1998
Average Width
Year
(m)
1852
813
1917
547
1940
426
1962
284
1974
284
1998
219
[14]
P.S./E. Sci.–Aug. ’15
ADVERTISEMENT
0 votes
Related Articles
Related forms


 - Pressure, Altitude & Density")


Related Categories
Parent category: Education