Physical Setting - Science Worksheet Page 12
ADVERTISEMENT
 1
1 2
2 3
3 4
4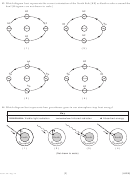 5
5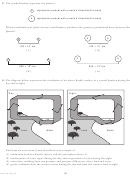 6
6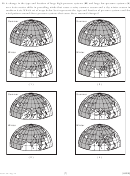 7
7 8
8 9
9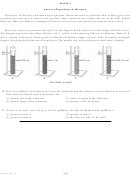 10
10 11
11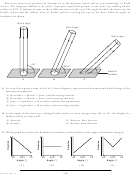 12
12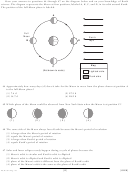 13
13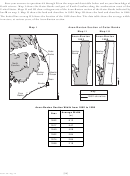 14
14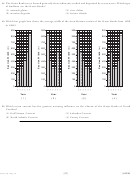 15
15 16
16 17
17 18
18 19
19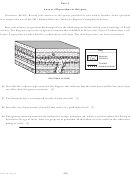 20
20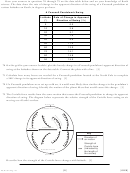 21
21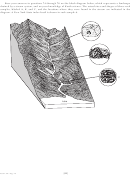 22
22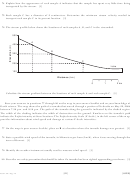 23
23 24
24 25
25 26
26 27
27 28
28Base your answers to questions 41 through 43 on the diagrams below and on your knowledge of Earth
science. The diagrams, labeled A, B, and C, represent equal-sized portions of the Sun’s rays striking Earth’s
surface at 23.5° N latitude at noon at three different times of the year. The angle at which the Sun’s rays hit
Earth’s surface and the relative areas of Earth’s surface receiving the rays at the three different angles of
insolation are shown.
Sun’s rays
Sun’s rays
Sun’s rays
90°
66.5°
43°
Earth’s
surface
A
B
C
41 As viewed in sequence from A to B to C, these diagrams represent which months and which change in the
intensity of insolation?
(1) December → March → June; and decreasing intensity
(2) December → March → June; and increasing intensity
(3) June → September → December; and decreasing intensity
(4) June → September → December; and increasing intensity
42 As the angle of the Sun’s rays striking Earth’s surface at noon changes from 90° to 43°, the length of a
shadow cast by an object will
(1) decrease
(3) decrease, then increase
(2) increase
(4) increase, then decrease
43 Which graph best shows the duration of insolation at this location as the angle of insolation changes?
90
66.5
43
90
66.5
43
90
66.5
43
90
66.5
43
Angle (°)
Angle (°)
Angle (°)
Angle (°)
( 3 )
( 4 )
( 1 )
( 2 )
[12]
P.S./E. Sci.–Aug. ’15
ADVERTISEMENT
0 votes
Related Articles
Related forms


 - Pressure, Altitude & Density")


Related Categories
Parent category: Education