Integrated Algebra Worksheet Page 10
ADVERTISEMENT
 1
1 2
2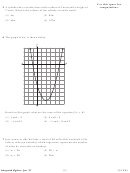 3
3 4
4 5
5 6
6 7
7 8
8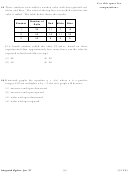 9
9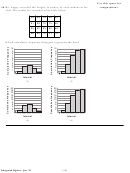 10
10 11
11 12
12 13
13 14
14 15
15 16
16 17
17 18
18 19
19 20
20 21
21 22
22 23
23 24
24Use this space for
30 Mr. Suppe recorded the height, in inches, of each student in his
computations.
class. The results are recorded in the table below.
60
59
70
65
64
61
58
72
75
66
65
67
63
62
68
68
69
74
61
70
Which cumulative frequency histogram represents the data?
10
10
9
9
8
8
7
7
6
6
5
5
4
4
3
3
2
2
1
1
55-59 55-64 55-69
55-74
55-79
55-59 60-64 65-69
70-74
75-79
Interval
Interval
(1)
( 3)
20
20
18
18
16
16
14
14
12
12
10
10
8
8
6
6
4
4
2
2
55-59 60-64 65-69
70-74
75-79
55-59 55-64 55-69
55-74
55-79
Interval
Interval
(2)
( 4 )
[10]
Integrated Algebra – Jan. ’15
ADVERTISEMENT
0 votes
Related Articles
Related forms
 Integrated Algebra Worksheet - The University Of The State Of New York Regents High School Examination
Education
Integrated Algebra Worksheet - The University Of The State Of New York Regents High School Examination
Education


 Regents High School Examination - Integrated Algebra Worksheet - The University Of The State Of New York, 2010
Education
Regents High School Examination - Integrated Algebra Worksheet - The University Of The State Of New York, 2010
Education
 Regents High School Examination - Integrated Algebra Worksheet - The University Of The State Of New York - 2009
Education
Regents High School Examination - Integrated Algebra Worksheet - The University Of The State Of New York - 2009
Education
 Regents High School Examination - Integrated Algebra Worksheet - The University Of The State Of New York, 2010
Education
Regents High School Examination - Integrated Algebra Worksheet - The University Of The State Of New York, 2010
Education


Related Categories
Parent category: Education