Ap Physics 1 Summer Assignment Worksheet Page 12
ADVERTISEMENT
 1
1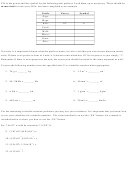 2
2 3
3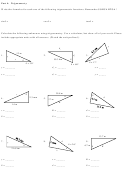 4
4 5
5 6
6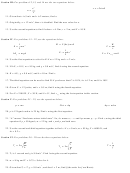 7
7 8
8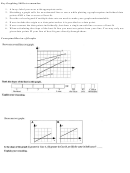 9
9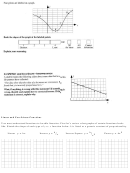 10
10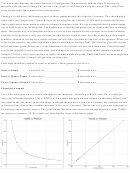 11
11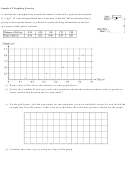 12
12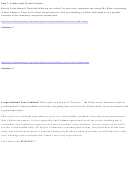 13
13Sample AP Graphing Exercise
A steel sphere is dropped from rest and the distance of the fall is given by the equation
1
2
�� =
����
. D is the distance fallen and t is the time of the fall. The acceleration due to
2
gravity is the constant known as g. Below is a table showing information on the first
two meters of the sphere’s descent.
a) Draw a line of best fit for the distance vs. time graph above.
b) If only the variables D and t are used, what quantities should the student graph in order to produce a
linear relationship between the two quantities?
c) On the grid below, plot the data points for the quantities you have identified in part (b), and sketch the
straight-line fit to the points. Label your axes and show the scale that you have chosen for the graph.
d) Calculate the value of g by using the slope of the graph.
ADVERTISEMENT
0 votes
Related Articles
Related forms


Related Categories
Parent category: Education