Ap Physics 1 Summer Assignment Worksheet Page 11
ADVERTISEMENT
 1
1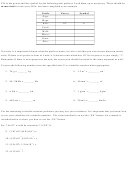 2
2 3
3 4
4 5
5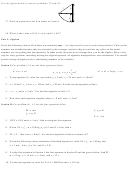 6
6 7
7 8
8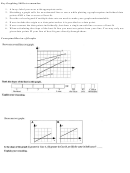 9
9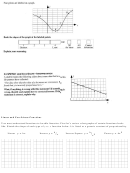 10
10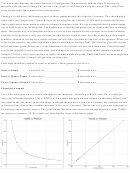 11
11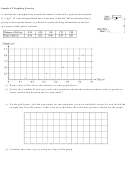 12
12 13
13You will notice that only the linear function is a straight line. We can easily find the slope of our line by
measuring the rise and dividing it by the run of the graph or calculating it using two points. The value of the
slope should equal the constant k from the equation.
Finding k is a bit more challenging in the last three graphs because the slope isn’t constant. This should make
sense since your graphs aren’t linear. So how do we calculate our constant, k? We need to transform the non-
linear graph into a linear graph in order to calculate a constant slope. We can accomplish this by transforming
one or both of the axes for the graph. The hardest part is figuring out which axes to change and how to change
them. The easiest way to accomplish this task is to solve your equation for the constant. Note in the examples
from the last page there is only one constant, but this process could be done for other equations with multiple
constants. Instead of solving for a single constant, put all of the constants on one side of the equation. When you
solve for the constant, the other side of the equation should be in fraction form. This fraction gives the rise and
run of the linear graph. Whatever is in the numerator is the vertical axis and the denominator is the horizontal
axis. If the equation is not in fraction form, you will need to inverse one or more of the variables to make a
fraction. First let’s solve each equation to figure out what we should graph. Then look below at the example and
complete the last one, a sample AP question, on your own.
State what should be graphed in order to produce a linear graph to solve for k.
Inverse Graph
Vertical Axis:_____________________
Horizontal Axis: ____________________
Inverse Square Graph Vertical Axis:_____________________
Horizontal Axis: ____________________
Power (Square) Graph Vertical Axis:_____________________
Horizontal Axis: ____________________
Chemistry Example
Let’s look at an equation you should remember from chemistry. According to Boyle’s the law, an ideal gas
obeys the following equation ��
��
= ��
��
= ��. This states that pressure and volume are inversely related, and
1
1
2
2
the graph on the left shows an inverse shape. Although the equation is equal to a constant, the variables are not
in fraction form. One of the variables, pressure in this case, is inverted. This means every pressure data point is
divided into one to get the inverse. The graph on the left shows the linear relationship between volume V and
the inverse of pressure 1/P. We could now calculate the slope of this linear graph.
ADVERTISEMENT
0 votes
Related Articles
Related forms


Related Categories
Parent category: Education