Early Childhood Program Participation, From The National Household Education Surveys Program Of 2012 - U.s. Department Of Education Page 58
ADVERTISEMENT
 1
1 2
2 3
3 4
4 5
5 6
6 7
7 8
8 9
9 10
10 11
11 12
12 13
13 14
14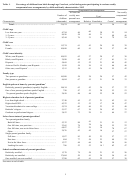 15
15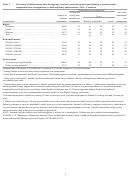 16
16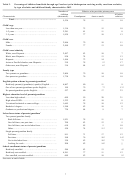 17
17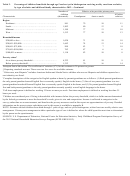 18
18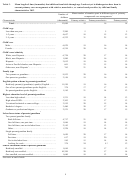 19
19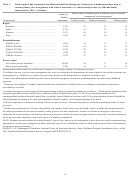 20
20 21
21 22
22 23
23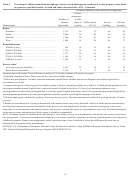 24
24 25
25 26
26 27
27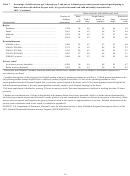 28
28 29
29 30
30 31
31 32
32 33
33 34
34 35
35 36
36 37
37 38
38 39
39 40
40 41
41 42
42 43
43 44
44 45
45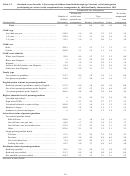 46
46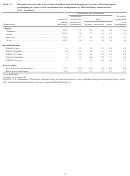 47
47 48
48 49
49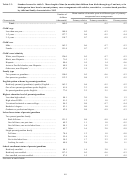 50
50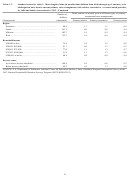 51
51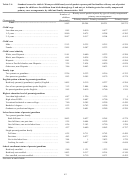 52
52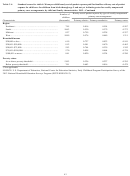 53
53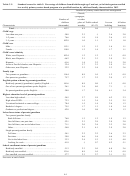 54
54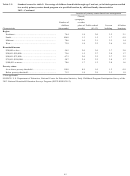 55
55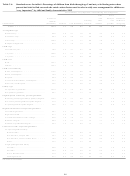 56
56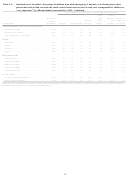 57
57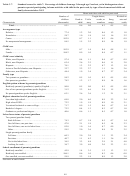 58
58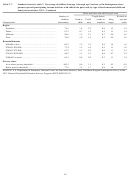 59
59Table C-7.
Standard errors for table 7: Percentage of children from age 3 through age 5 and not yet in kindergarten whose
parents reported participating in home activities with child in the past week, by type of involvement and child and
family characteristics: 2012
Home activities with child in past week
Number of
Taught letters,
Worked on
Read to
Told a
words, or
Sang
arts and
children
child
story
numbers
songs
crafts
Characteristic
(thousands)
Total…………………………………………………
85.1
0.6
0.9
0.3
0.5
0.8
Arrangement type
Relative………………………………..…………………
77.4
1.2
2.0
0.6
1.2
1.8
Nonrelative………………………………………………
58.7
1.0
1.8
1.0
1.6
2.2
Center…………………..…………………………………
102.9
0.7
1.1
0.3
0.6
0.9
No nonparental arrangement………………………………
84.5
1.5
2.2
0.9
1.4
1.9
Child’s sex
Male…………………..……………………………………
103.9
0.7
1.4
0.4
0.8
1.1
Female…………………..…………………………………
104.2
0.9
1.0
0.4
0.7
1.1
Child’s race/ethnicity
White, non-Hispanic………………………………………
97.4
0.4
1.1
0.4
0.7
0.9
Black, non-Hispanic………………………………………
63.4
2.6
2.3
0.6
1.1
2.8
Hispanic…………………………………………………
76.1
1.3
2.2
0.7
1.3
1.9
Asian or Pacific Islander, non-Hispanic…………………
32.7
2.2
2.7
1.1
1.6
2.6
Other race, non-Hispanic…………………………………
44.4
1.9
3.4
0.7
2.7
3.4
Family type
Two parents or guardians…………………………………
94.2
0.5
1.0
0.3
0.5
0.8
One parent or guardian……………………………………
78.2
1.2
1.7
0.8
1.4
1.6
English spoken at home by parents/guardians
Both/only parent(s)/guardian(s) speak(s) English…………
90.0
0.5
0.9
0.3
0.5
0.8
One of two parents/guardians speaks English……………
31.2
2.2
4.6
2.8
1.5
4.8
No parent/guardian speaks English………………………
63.1
2.6
3.6
1.2
2.1
3.1
Highest education level of parents/guardians
Less than high school……………………………………
69.8
2.0
4.0
0.9
2.2
3.4
High school/GED…………………………………………
72.2
1.9
1.9
0.9
1.9
2.1
Vocational/technical or some college……………………
71.7
0.9
1.5
0.6
0.7
1.4
Bachelor’s degree…………………………………………
72.2
0.4
1.3
0.3
0.7
1.0
Graduate or professional degree…………………………
40.6
0.6
1.1
0.5
0.7
1.0
Labor force status of parents/guardians
Two-parent/guardian family
Both full time……………………………………………
74.3
0.7
1.8
0.5
0.7
1.4
One full time, one part time……………………………
47.8
2.1
1.9
0.5
1.4
2.3
One full time, one not in labor force……………………
82.8
1.0
1.6
0.7
0.9
1.6
Other…………………………………………………
59.5
2.0
3.6
0.8
2.1
2.5
Single-parent/guardian family
Full time………………………………………………
60.3
2.0
2.9
1.1
2.3
2.4
Part time………………………………………………
40.7
1.1
4.2
1.1
3.6
4.2
Not in the labor force…………………………………
36.5
3.3
4.8
2.9
3.1
4.0
Looking for work………………………………………
36.7
3.9
6.8
2.0
2.3
5.1
School enrollment of parents/guardians
Both/only enrolled…………………………………………
45.9
1.4
3.5
1.2
1.3
3.2
Both/only not enrolled……………………………………
106.1
0.6
1.0
0.3
0.6
0.8
One enrolled, one not enrolled……………………………
59.9
2.2
1.8
0.9
1.3
2.8
See notes at end of table.
48
ADVERTISEMENT
0 votes
Related Articles
Related forms


Related Categories
Parent category: Legal