Early Childhood Program Participation, From The National Household Education Surveys Program Of 2012 - U.s. Department Of Education Page 17
ADVERTISEMENT
 1
1 2
2 3
3 4
4 5
5 6
6 7
7 8
8 9
9 10
10 11
11 12
12 13
13 14
14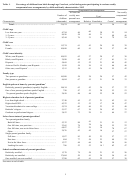 15
15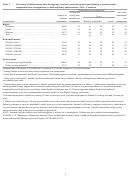 16
16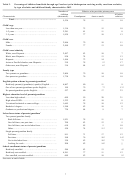 17
17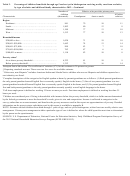 18
18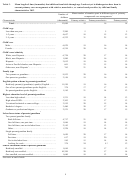 19
19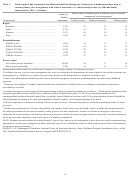 20
20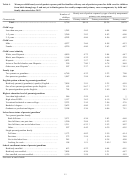 21
21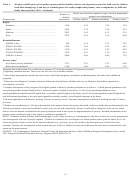 22
22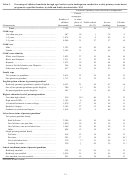 23
23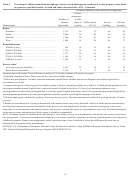 24
24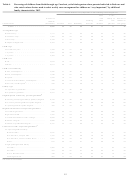 25
25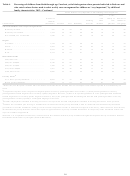 26
26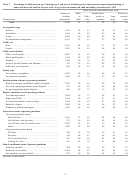 27
27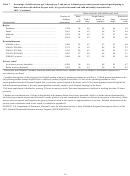 28
28 29
29 30
30 31
31 32
32 33
33 34
34 35
35 36
36 37
37 38
38 39
39 40
40 41
41 42
42 43
43 44
44 45
45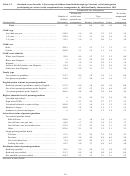 46
46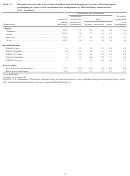 47
47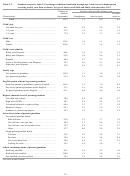 48
48 49
49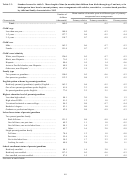 50
50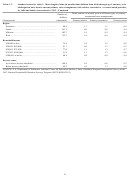 51
51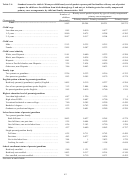 52
52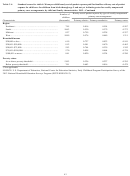 53
53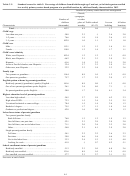 54
54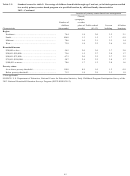 55
55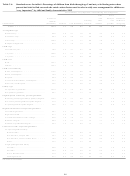 56
56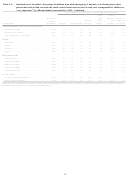 57
57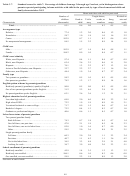 58
58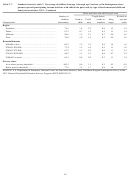 59
59Table 2.
Percentage of children from birth through age 5 and not yet in kindergarten receiving weekly care from a relative,
by type of relative and child and family characteristics: 2012
Relative who provides primary care
Number of
children
All other
Characteristic
(thousands)
Grandparent
Aunt or uncle
relatives
Total…………………………………………………
5,534
78
11
10
Child’s age
Less than one year…………………………………………
1,314
75
15
10
1–2 years…………………………………………………
2,281
81
11
8
3–5 years…………………………………………………
1,939
77
10
13
Child’s sex
Male……………………………………..…………………
2,966
79
10
11
Female…………...………………………………………
2,568
77
13
10
Child’s race/ethnicity
White, non-Hispanic………………………………………
2,507
83
10
7
Black, non-Hispanic………………………………………
930
74
13
13
Hispanic……………..……………………………………
1,564
72
14
14
Asian or Pacific Islander, non-Hispanic…………………
219
78
5 !
17
1
Other race, non-Hispanic
…………………………………
314
84
6 !
10 !
Family type
Two parents or guardians…………………………………
3,804
79
10
10
One parent or guardian……………………………………
1,730
76
14
10
2
English spoken at home by parents/guardians
Both/only parent(s)/guardian(s) speak(s) English…………
4,807
80
11
9
One of two parents/guardians speaks English……………
199
79
7 !
13 !
No parent/guardian speaks English………………………
527
60
17
23
Highest education level of parents/guardians
Less than high school……………………………………
699
59
20
21
High school/GED…………………………………………
1,222
82
10
8
Vocational/technical or some college……………………
1,645
78
10
12
Bachelor’s degree…………………………………………
1,240
82
10
8
Graduate or professional degree…………………………
728
84
9
7
3
Labor force status of parents/guardians
Two-parent/guardian family
Both full time……………………………………………
1,921
78
11
12
One full time, one part time……………………………
708
83
12
5
One full time, one not in labor force……………………
618
85
5
10
Other……..……………………………………………
558
74
11 !
15
Single-parent/guardian family
Full time………………………………………………
811
71
17
12
Part time………………………………………………
360
76
10 !
14 !
Not in the labor force…………………………………
358
82
10 !
7 !
Looking for work………………………………………
200
82
14 !
‡
School enrollment status of parents/guardians
Both/only enrolled…………………………………………
584
83
13
4 !
Both/only not enrolled……………………………………
4,261
77
11
12
One enrolled, one not enrolled……………………………
689
82
10
9 !
See notes at end of table.
7
ADVERTISEMENT
0 votes
Related Articles
Related forms


Related Categories
Parent category: Legal