Performance And Accountability Report - Fiscal Year 2013 - Federal Aviation Administration - U.s. Department Of Transportation Page 45
ADVERTISEMENT
 1
1  2
2  3
3  4
4  5
5  6
6  7
7  8
8  9
9  10
10  11
11  12
12 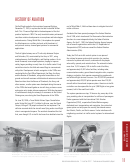 13
13  14
14  15
15  16
16  17
17  18
18  19
19  20
20 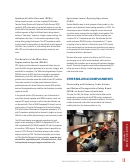 21
21  22
22  23
23  24
24  25
25  26
26  27
27 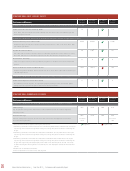 28
28 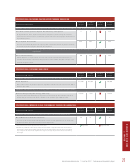 29
29  30
30  31
31  32
32  33
33  34
34  35
35  36
36  37
37  38
38  39
39  40
40  41
41  42
42  43
43  44
44 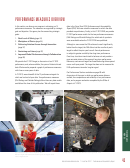 45
45 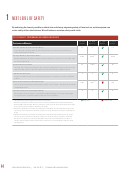 46
46  47
47  48
48  49
49  50
50 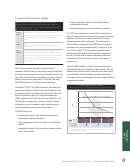 51
51 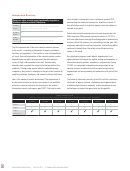 52
52 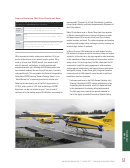 53
53 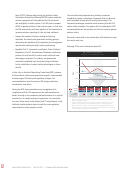 54
54 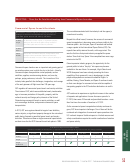 55
55  56
56 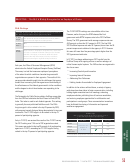 57
57 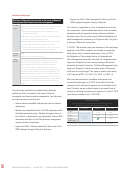 58
58 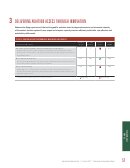 59
59 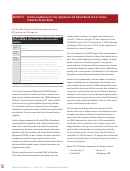 60
60  61
61 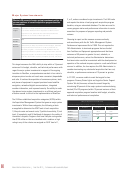 62
62 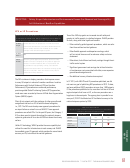 63
63 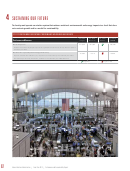 64
64  65
65 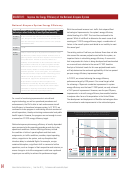 66
66  67
67  68
68  69
69 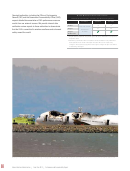 70
70  71
71  72
72  73
73  74
74  75
75  76
76  77
77  78
78  79
79  80
80  81
81  82
82  83
83  84
84  85
85  86
86  87
87  88
88 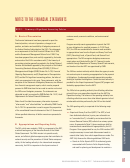 89
89  90
90  91
91  92
92  93
93  94
94  95
95 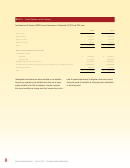 96
96 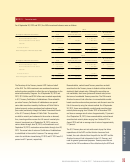 97
97 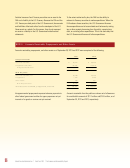 98
98 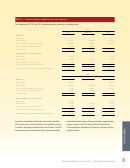 99
99 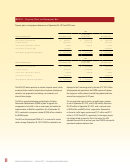 100
100  101
101  102
102  103
103  104
104  105
105  106
106 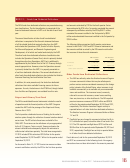 107
107  108
108  109
109 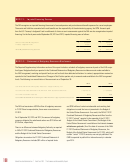 110
110 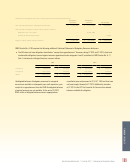 111
111  112
112 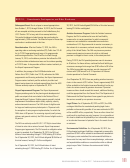 113
113 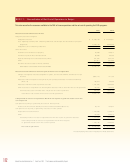 114
114  115
115  116
116 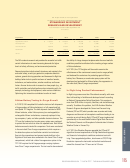 117
117  118
118  119
119  120
120  121
121  122
122  123
123  124
124  125
125  126
126  127
127  128
128  129
129  130
130  131
131  132
132  133
133  134
134  135
135  136
136  137
137  138
138  139
139  140
140  141
141  142
142  143
143  144
144  145
145  146
146  147
147  148
148  149
149  150
150 PERFORMANCE MEASURES OVERVIEW
In this section, we discuss our progress in achieving our 14
data in the Fiscal Year 2014 Performance and Accountability
performance measures. The measures are organized by strategic
Report (PAR). We have noted the measures for which the data
goal and objective. Our agency has five overarching strategic
provided are preliminary. Finally, in this FY 2013 PAR, we provide
goals:
FY 2012 performance results for the two performance measures
(FAA Ratings and Outside Ratings) for which end-of-year data
1.
Next Level of Safety
(page 44)
were unavailable when the FY 2012 PAR was published.
2.
Workplace of Choice
(page 54)
3.
Delivering Aviation Access through Innovation
Although in some cases the FAA achieved a result significantly
(page 57)
better than the target, the FAA did not set the new fiscal year’s
target to reflect the prior year’s result. Annual performance
4.
Sustaining our Future
(page 62)
is subject to greater variability than long-term performance.
5.
Improved Global Performance through Collaboration
Over time, short-term trends tend to balance out and provide a
(page 66)
more accurate picture of the agency’s long-term performance.
We provide the FY 2013 target, a discussion of our FY 2013
Moreover, some annual targets are baselined using data acquired
performance, and, when available, five years of historical trend
over a multi-year period. The target has been set to measure the
data. We have also prepared a graph of performance measures
FAA’s performance toward a long-term goal.
with three or more years of data.
Our Performance Section concludes on page 69 with
In FY 2013, we achieved 8 of the 12 performance targets for
discussions of the ways in which our performance data are
which we had end-of-year data. Two performance measures
verified; the completeness and reliability of our performance
(FAA Ratings and Outside Ratings) did not have any data results
data; and a program evaluation completed by the Office of
available at the time of this publication. We will report these
Airports in FY 2013.
Top: Pilots in cockpit. Photo: .
Cargo compartment smoke-detection testing. Photo: FAA.
Bottom: Flight attendant demonstrating use of oxygen mask.
Photo: .
43
|
|
Federal Aviation Administration
Fiscal Year 2013
Performance and Accountability Report
ADVERTISEMENT
0 votes
Related Articles
Related forms
 Form Hud-2063 - Schedule Of Federal Housing Administration Debentures Authorized And Requisitioned - Original Issue - Office Of Housing Federal Housing Commissioner - U.s. Department Of Housing And Urban Development
Legal
Form Hud-2063 - Schedule Of Federal Housing Administration Debentures Authorized And Requisitioned - Original Issue - Office Of Housing Federal Housing Commissioner - U.s. Department Of Housing And Urban Development
Legal
 Form 4530 - Registration And Amendments Of Foreign Charter Operators Under Part 380 Of The Regulations Of The Department Of Transportation - U.s. Department Of Transportation
Legal
Form 4530 - Registration And Amendments Of Foreign Charter Operators Under Part 380 Of The Regulations Of The Department Of Transportation - U.s. Department Of Transportation
Legal


 - U.s. Department Of Transportation") Faa Form 8110-26 - Supplemental Type Inspection Report (stir) - U.s. Department Of Transportation
Legal
Faa Form 8110-26 - Supplemental Type Inspection Report (stir) - U.s. Department Of Transportation
Legal
 Form Hud-2537 - Mortgagee's Application For Partial Settlement - Multifamily Mortgage - Office Of Housing Federal Housing Commissioner - U.s. Department Of Housing And Urban Development
Legal
Form Hud-2537 - Mortgagee's Application For Partial Settlement - Multifamily Mortgage - Office Of Housing Federal Housing Commissioner - U.s. Department Of Housing And Urban Development
Legal


Related Categories
Parent category: Business