Performance And Accountability Report - Fiscal Year 2013 - Federal Aviation Administration - U.s. Department Of Transportation Page 34
ADVERTISEMENT
 1
1  2
2  3
3  4
4  5
5  6
6  7
7  8
8  9
9  10
10  11
11  12
12  13
13 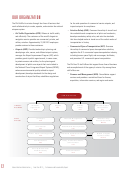 14
14  15
15  16
16  17
17  18
18  19
19  20
20  21
21  22
22  23
23  24
24  25
25  26
26 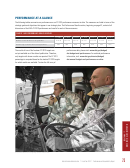 27
27  28
28  29
29  30
30  31
31 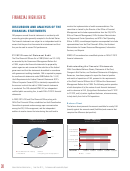 32
32 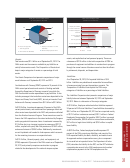 33
33 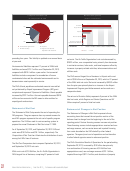 34
34 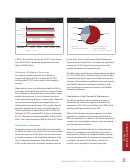 35
35  36
36  37
37  38
38  39
39  40
40  41
41  42
42  43
43  44
44  45
45  46
46  47
47  48
48  49
49 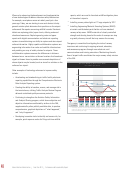 50
50 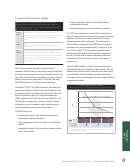 51
51  52
52  53
53 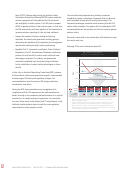 54
54 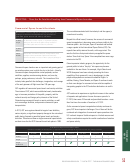 55
55  56
56  57
57  58
58  59
59  60
60  61
61  62
62 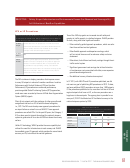 63
63  64
64  65
65 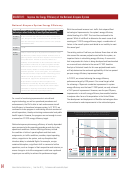 66
66  67
67  68
68 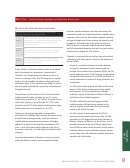 69
69  70
70  71
71  72
72  73
73  74
74  75
75  76
76  77
77  78
78  79
79  80
80  81
81  82
82  83
83  84
84  85
85  86
86 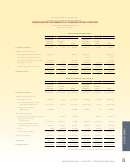 87
87 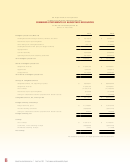 88
88  89
89  90
90  91
91  92
92  93
93  94
94  95
95  96
96  97
97 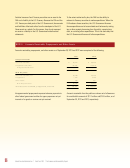 98
98 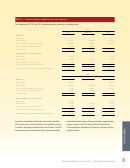 99
99  100
100  101
101  102
102  103
103 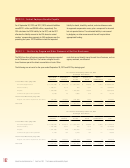 104
104 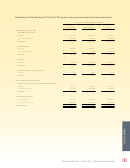 105
105 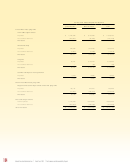 106
106 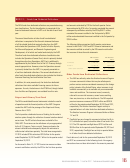 107
107  108
108  109
109  110
110 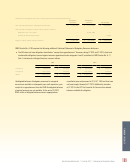 111
111 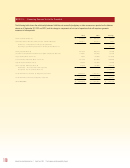 112
112  113
113 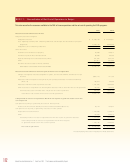 114
114 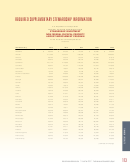 115
115 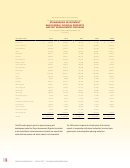 116
116  117
117  118
118  119
119 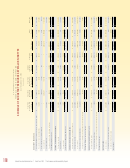 120
120 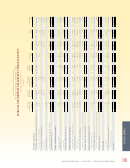 121
121  122
122  123
123  124
124  125
125  126
126  127
127  128
128  129
129  130
130 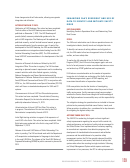 131
131  132
132  133
133  134
134  135
135  136
136  137
137 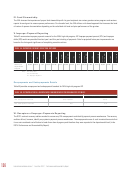 138
138  139
139  140
140  141
141  142
142  143
143  144
144  145
145  146
146  147
147  148
148  149
149  150
150 Composition of Net Cost
Net Cost Comparison
as of September 30, 2013
(Dollars in Thousands)
Air Traffic
2%
Organization
Airports
67%
22%
Aviation Safety
9%
Regions and Center
Operations & All Other
Air Traffic Organization
Airports
n
n
0
$ THOUSANDS
2,000,000 4,000,000 6,000,000 8,000,000 10,000,000 12,000,000
Aviation Safety
Regions and Center
n
n
2013
2012
n
n
Operations & All Other
preceding four years. This liability is updated on an annual basis
net costs. The Air Traffic Organization’s net costs decreased by
at year end.
$292.2 million, on a comparative basis, primarily from decreases
in contractor services, labor costs, and travel expenses offset by
Environmental liabilities represent 17 percent of FAA’s total
increases in property related activities, telecommunications and
liabilities and were $751.7 million as of September 30, 2013,
utilities costs.
compared with $810.4 million a year earlier. Environmental
liabilities include a component for remediation of known
The FAA’s second largest line of business is Airports with a net
contaminated sites and the estimated environmental cost to
cost of $3.6 billion as of September 30, 2013, which is 22 percent
decommission assets presently in service.
of the FAA’s total net costs. Net costs increased by $463.3 million
from the prior year primarily due to an increase in the Airport
The FAA’s Grants payable are estimated amounts incurred but
Improvement Program grant disbursements and accruals on a
not yet claimed by Airport Improvement Program (AIP) grant
comparative basis.
recipients and represent 18 percent of liabilities. Grants payable
increased by $132.2 million. Accounts payable decreased $57.8
The net cost of Aviation Safety represents 9 percent of the FAA’s
million and are amounts the FAA owes to other entities for
total net costs, while Regions and Center Operations and All
unpaid goods and services.
Other comprise 2 percent of total net costs.
Statement of Net Cost
Statement of Changes in Net Position
The Statement of Net Cost presents the cost of operating the
The Statement of Changes in Net Position presents those
FAA programs. The gross expense less any earned revenue for
accounting items that caused the net position section of the
each FAA program represents the net cost of specific program
balance sheet to change from the beginning to the end of the
operations. The FAA has used its cost accounting system to
reporting period. Various financing sources increase net position.
prepare the annual Statement of Net Cost since FY 1999.
These financing sources include appropriations received and non-
exchange revenue, such as excise taxes and imputed financing
As of September 30, 2013, and September 30, 2012 FAA’s net
from costs absorbed on the FAA’s behalf by other federal
costs were $16.2 billion and $16.1 billion, respectively. The
agencies. The agency’s net cost of operations and net transfers
Composition of Net Cost chart illustrates the distribution of costs
to other federal agencies serve to reduce net position.
among the FAA’s lines of business.
The FAA’s Cumulative Results of Operations for the period ending
The Net Cost Comparison chart compares September 30, 2012,
September 30, 2013, increased by $1.8 billion due primarily
and September 30, 2013 net costs.
to a combination of financing sources of $4.4 billion from
With a net cost of $10.9 billion, the Air Traffic Organization is
appropriations used, non-exchange revenue of $13.1 billion,
FAA’s largest line of business, comprising 67 percent of total
imputed financing of $571.0 million, and donations of property
32
|
|
Federal Aviation Administration
Fiscal Year 2013
Performance and Accountability Report
ADVERTISEMENT
0 votes
Related Articles
Related forms
 Form Hud-2063 - Schedule Of Federal Housing Administration Debentures Authorized And Requisitioned - Original Issue - Office Of Housing Federal Housing Commissioner - U.s. Department Of Housing And Urban Development
Legal
Form Hud-2063 - Schedule Of Federal Housing Administration Debentures Authorized And Requisitioned - Original Issue - Office Of Housing Federal Housing Commissioner - U.s. Department Of Housing And Urban Development
Legal
 Form 4530 - Registration And Amendments Of Foreign Charter Operators Under Part 380 Of The Regulations Of The Department Of Transportation - U.s. Department Of Transportation
Legal
Form 4530 - Registration And Amendments Of Foreign Charter Operators Under Part 380 Of The Regulations Of The Department Of Transportation - U.s. Department Of Transportation
Legal


 - U.s. Department Of Transportation") Faa Form 8110-26 - Supplemental Type Inspection Report (stir) - U.s. Department Of Transportation
Legal
Faa Form 8110-26 - Supplemental Type Inspection Report (stir) - U.s. Department Of Transportation
Legal
 Form Hud-2537 - Mortgagee's Application For Partial Settlement - Multifamily Mortgage - Office Of Housing Federal Housing Commissioner - U.s. Department Of Housing And Urban Development
Legal
Form Hud-2537 - Mortgagee's Application For Partial Settlement - Multifamily Mortgage - Office Of Housing Federal Housing Commissioner - U.s. Department Of Housing And Urban Development
Legal


Related Categories
Parent category: Business