Form 500-B - Information Return - Report Of Nonresident Member Income Tax Withheld - 2003 Page 37
Download a blank fillable Form 500-B - Information Return - Report Of Nonresident Member Income Tax Withheld - 2003 in PDF format just by clicking the "DOWNLOAD PDF" button.
Open the file in any PDF-viewing software. Adobe Reader or any alternative for Windows or MacOS are required to access and complete fillable content.
Complete Form 500-B - Information Return - Report Of Nonresident Member Income Tax Withheld - 2003 with your personal data - all interactive fields are highlighted in places where you should type, access drop-down lists or select multiple-choice options.
Some fillable PDF-files have the option of saving the completed form that contains your own data for later use or sending it out straight away.
ADVERTISEMENT
 1
1 2
2 3
3 4
4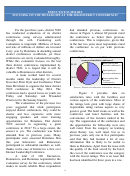 5
5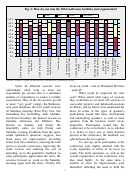 6
6 7
7 8
8 9
9 10
10 11
11 12
12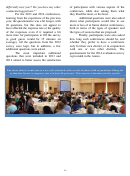 13
13 14
14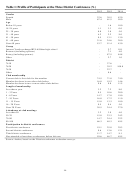 15
15 16
16 17
17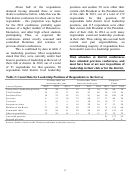 18
18 19
19 20
20 21
21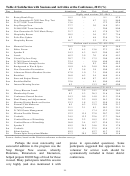 22
22 23
23 24
24 25
25 26
26 27
27 28
28 29
29 30
30 31
31 32
32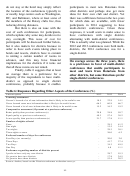 33
33 34
34 35
35 36
36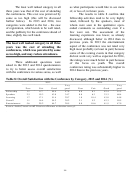 37
37 38
38 39
39 40
40 41
41 42
42 43
43 44
44 45
45 46
46 47
47 48
48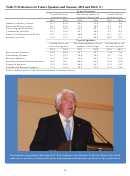 49
49 50
50 51
51 52
52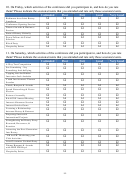 53
53 54
54 55
55 56
56 57
57The least well ranked category in all
as what participants would like to see more
three years was that of the cost of attending
of, or less of, in future years.
the conferences. This cost was perceived by
The results in table 8 confirm that
some as too high (this will be discussed
fellowship activities tend to be very highly
further below).
In 2013 and 2014, two
rated, followed by the speakers, most of
categories were added to the list – the ease
whom were seen in the qualitative open-
of registration, which tends to be well rated,
ended comments as outstanding even if a
and the publicity for the conference ahead of
few were not. The assessment of the
time, slightly less well rated.
learning experience was lower, as already
discussed, although better in 2014 than in
previous years. In 2013 the entertainment
The least well ranked category in all three
aspect of the conference was not rated very
years was the cost of attending the
high most probably (at least in part) because
conferences, which was perceived by some
some of the evening events in that category
as too high, and may reduce attendance.
did not work very well as expected. In 2014,
the ratings were much better in part because
Three additional questions were
of the focus on youth. The overall
asked in the 2013 and 2014 questionnaires
conference rating was substantially higher in
to try to better assess overall satisfaction
2014 than in the previous years.
with the conference in various areas, as well
Table 8: Overall Satisfaction with the Conference by Category, 2013 and 2014 (%)
2013
2014
Very
Very
Poor
Fair
Good
good
Poor
Fair
Good
good
Fellowship
1.1
6.7
44.4
47.8
0.0
6.1
42.4
51.5
Speakers
2.3
19.3
43.8
34.7
0.0
6.3
33.3
60.4
Learning
1.7
17.1
51.4
29.7
1.0
10.4
43.8
44.8
Overall
1.1
16.4
54.2
28.2
2.1
5.2
42.3
50.5
Entertainment
5.6
29.2
44.7
20.5
0.0
10.6
41.5
47.9
Source: Author, based on the District conference evaluation surveys.
36
ADVERTISEMENT
0 votes
Related Articles
Related forms


Related Categories
Parent category: Financial